| Bar chart for total protein intensity | tomasz gozdziewicz | 2021-01-26 03:51 |
Hi Skyline Crew! I just love Skyline and I'm using it for peptide/protein relative quantitation. One minor issue I notice is that in the replicate comparison plot I cannot show total (summed) intensity for a particular protein as a bar chart. The only visible Graph style is Line. The Bar Graph is perfectly present when I select any peptide but for whole protein, it changes for line style. I'm not sure it is a real issue or maybe it is a reason for such plot style for protein selection. Thanks for a comment. Best Regards, Tomasz Gozdziewicz Skyline Daily 20.2.1.384; Windows 10 |
||
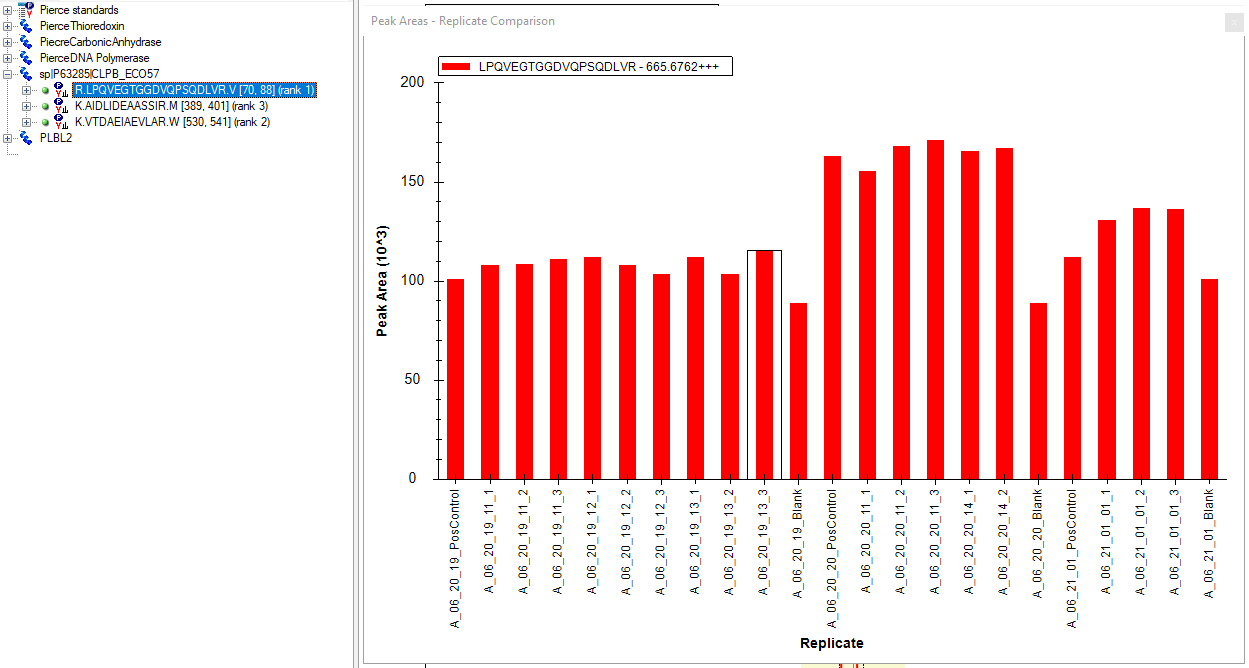 PeakArea_Peptide.png
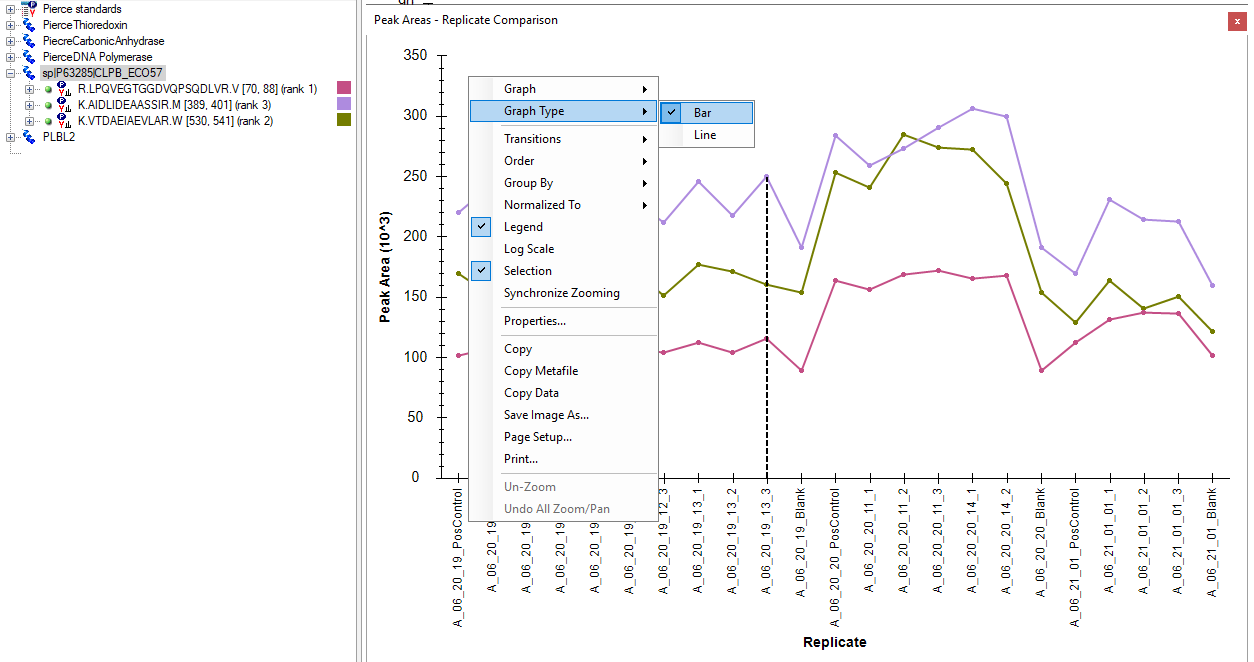 PeakArea_Protein.png