| Brendan MacLean responded: |
2019-11-07 13:10 |
Thanks, Brett. Matt, Brian, and I worked hard on the performance.
For my recent processing, we have used MaxQuant msms.txt files for the libraries. When doing this, I think you want to try to disable its fragment ion charge state deconvolution, or you will end up with MS/MS spectra with charge 1 and 2 fragments merged into charge 1 making them less than ideal for subsequent DIA library use, though, not completely unusable. If you have other search tools you would like to try this with, ProteoWizard msConvert should make that possible with exported MGF or mzML. I have heard PEAKS also works. We would be interested in working with you to support any other pipeline you have, if the search provider is also willing to do the work to pass through the IM values.
We have also tested a Mascot pipeline that passes through IMS values, and, yes, they are important. Once you have your library built, open it with View > Spectral Libraries. Review some of the spectrum matches and make sure you have both RT: #.### and IM: #.###Vs/cm^2
Then you want to go into Peptide Settings > Prediction (sorry, we are going to move this to Transition Settings > Ion Mobility soon) and check "Use spectral library ion mobility values when present". In my most recent optimization analysis, I came away feeling that a "Resolving power" setting of 50 worked best for the data I have, but anyway from 20-50 should work okay.
Thanks for posting on the support board. Looking forward to hearing more as you get going with diaPASEF in Skyline.
--Brendan
|
| |
| Brett Phinney responded: |
2019-11-08 09:47 |
Thanks!
Well I have made a little progress. I tried to use the most recent version of maxquant to search a timstof dda file and load it into skyline. Looks like it read the ion mobility data okay, but not the rt. See attached
I also tried to export a peaks skyline export, but the export file ballooned to 12GB after exporting for 12 hours and then my computer hard drive ran out of space... sigh.... Peaks seems to have an option to export a openMS file. Can I use that to build a library ?
thanks for all the help!!
|
|
| |
| Brendan MacLean responded: |
2019-11-08 10:06 |
Strange. I have never seen us fail to get RT from MaxQuant before. Can you post the msms.txt file to https://skyline.ms/files.url ?
Someone here will have a look at it. Maybe check with the PEAKS team on the export to Skyline feature. We would be happy to help them work through the apparent bug in their implementation.
If you can export the OpenMS version and post that to our file drop point as well, we can have a look at whether it contains enough information for us to use in this case.
Thanks for pushing through the initial integration issues to help us work out the kinks with other software.
--Brendan
|
| |
| Brett Phinney responded: |
2019-11-08 10:12 |
|
| |
| Matt Chambers responded: |
2019-11-11 08:11 |
It looks like a MaxQuant Bug: all the values in the RT column are 0. In the OpenSwath CSV, all the "normalized" retention times are negative. I'm not sure if those 2 facts are related.
The OpenSwath CSV seems to have everything we need except filename. Or does OpenSwath create a separate CSV for each input RAW?
|
| |
| Brett Phinney responded: |
2019-11-19 12:59 |
Hi everyone, know if there is any update to this? I'd like to try it again but I'm not sure I want to try maxquant again until it's fixed. Maxquant has been very slow for me for some strange reason. MSfragger has been working great for me with the timstof. Any chance I can use that to build the library?
I'm not sure about the openswath csv format, it was just an export option on peaks studio x+ and that's what it spit out.
Thanks! Using skyline for this would really be awesome!
Cheers
Brett
|
| |
| Matt Chambers responded: |
2019-11-19 13:05 |
No, I could report a bug on MaxQuant but in my experience they're not very responsive. Probably better for Brendan or someone to contact Juergen directly.
Can MSFragger create pepXMLs or be processed through TPP and get pepXMLs that way? We may be able to create a library from that.
|
| |
| Brett Phinney responded: |
2019-11-19 13:09 |
Actually it does! Here is an example. I looked at it briefly and it looks like it contains the ion mobility data
|
|
| |
| Matt Chambers responded: |
2019-11-19 13:10 |
Actually have you tried to import the OpenSWATH CSV as an assay library? (File -> Import -> Assay Library). That seems to work, although you'll need to edit the Skyline document to set the correct sample and instrument settings first or you'll get a lot of transition errors.
|
| |
| Brett Phinney responded: |
2019-11-19 13:14 |
no I haven't, thanks! I'll give that a shot!!
|
| |
| Brendan MacLean responded: |
2019-11-19 13:18 |
I don’t think File > Import > Assay Library support IMS values. Does the OpenSWATH CSV have IMS values?
We really want those. Kaipo and Brian may be able to help with that.
I am in South Africa with limited time during the day and no WiFi at my hotel.
If this is still an issue next week, I’ll try to help more.
|
| |
| Brett Phinney responded: |
2019-11-19 13:20 |
looks like the pepXML's from msfragger has them...at least from my quick perusal of the file
|
| |
| Brett Phinney responded: |
2019-11-20 14:13 |
btw just for fun I tried to make a library from a pepXML exported from a msfragger timstof search. Gave an error because it is looking for the spectrum file. msfragger does export a calibrated mgf if that helps.
|
|
| |
| qinzhang responded: |
2019-11-21 05:54 |
Hi All,
I also tried to loaded diaPASEF data to lastest Skyline based on spectra library bulit on masct dat result. In the end of import, it occured an error said"skyline win 32 error", and in final result, there is no imported MSMS spectra. I checked the spectra library, it contained CCS value. the workflow i used is that: File>import reslut>load mascot dat file to bulid library>load tdf file. Is this workflow right?
Best reagrds,
Qing
|
|
| |
| Brian Pratt responded: |
2019-11-21 09:23 |
Hi Qing,
That all sounds correct - can you share the files you're using so I can understand what went wrong?
Those files include:
Skyline document (important: use Skylines's File>Share>Complete menu item to create a .sky.zip file)
Mascot .dat file
Bruker .d directory
anything else you think might be important
You can upload to http://skyline.ms/files.url or we can arrange something private if you like.
Thanks
Brian Pratt
|
| |
| qinzhang responded: |
2019-11-24 21:50 |
Hi Brian,
My raw data is too big, so I have tried in China but it is too slow. Maybe we can arrange something like WebEx?
Best regards,
Qing
|
| |
| Brian Pratt responded: |
2019-11-24 22:14 |
Can we see a screenshot of the actual error?
Thanks
Brian
|
| |
| qinzhang responded: |
2019-12-01 23:19 |
Hi Brian,
Today I processed the same raw data in a windows 10 PC, not the windows7 PC I used before, the result is OK now.
|
| |
| Brian Pratt responded: |
2019-12-02 13:55 |
I am glad to hear that it is working for you now.
Though I should add for anyone reading this later that it is unlikely that whatever problem you were encountering on that system was due to it running Windows 7 (Skyline is automatically tested on Windows 7 several times a day).
Best Regards,
Brian
|
| |
| 604293671 responded: |
2019-12-03 18:57 |
Hi All,
I encountered a problem when I try to import diaPASEF data to Skyline. I have successfully built a spectral library with RT and CCS calue by MASCOT dat. Then I Use the menu item File>import reslut>load containing .d folder. The precursor ions were extracted well but product ions were missing.
|
|
| |
| Brendan MacLean responded: |
2019-12-03 19:07 |
Please post a screenshot of your Transition - Full-Scan tab. Have you defined a DIA isolation scheme in the MS/MS Filtering section? If so, please also post a screenshot of that.
Thanks.
--Brendan
|
| |
| 604293671 responded: |
2019-12-03 19:57 |
Isolation scheme was setting to all ions since I failed to import containing .d folder to specify isolation scheme .
|
|
| |
| Brendan MacLean responded: |
2019-12-04 10:21 |
That's not a good idea. I think you need to pre-specify the isolation scheme, which will properly limit your targeted precursors to just the m/z range actually isolated, though, it may work to specify a Use Results isolation scheme, e.g. "Results (0.5 margin)" which is available by default.
However, for the diaPASEF we have processed, we used a prespecified isolation scheme like this:
400 426 0.5
425 451 0.5
450 476 0.5
475 501 0.5
500 526 0.5
525 551 0.5
550 576 0.5
575 601 0.5
600 626 0.5
625 651 0.5
650 676 0.5
675 701 0.5
700 726 0.5
725 751 0.5
750 776 0.5
775 801 0.5
800 826 0.5
825 851 0.5
850 876 0.5
875 901 0.5
900 926 0.5
925 951 0.5
950 976 0.5
975 1,001 0.5
1,000 1,026 0.5
1,025 1,051 0.5
1,050 1,076 0.5
1,075 1,101 0.5
1,100 1,126 0.5
1,125 1,151 0.5
1,150 1,176 0.5
1,175 1,201 0.5
If you feel you used this same set of windows and a 0.5 margin, you could just paste this into Skyline. Unfortunately, it is not quite the same as SWATH (25 m/z) which is also available by default.
This has reminded me that we need to get the "Import..." button working for importing the isolation scheme from an existing diaPASEF data file, as is supported with other DIA/SWATH data file formats. With the current build, however, you need to know your isolation scheme and specify it accurately for this to work. (or you could try "Results (0.5 margin)" which I will now try very soon, but which may or may not work)
Thanks for being an early adopter and sharing your experience. We hope to have you happily processing your own diaPASEF data soon. Keep us posted on whether this helps at all.
--Brendan
|
| |
| Brett Phinney responded: |
2019-12-04 12:09 |
Hi everyone, any ideas on how to get a library in skyline without Mascot? I can generate some data if you need it :)
Cheers
Brett
|
| |
| Brendan MacLean responded: |
2019-12-04 12:31 |
Hi Brett,
I just released Skyline-daily 19.1.9.338 which was supposed to add MS Fragger pepXML support. I thought this was for you and you had already supplied Matt with example files.
Our own libraries have been built from MaxQuant msms.txt files provided by Bruker. So, as far as I know, there are 3 supported search engines which provide the necessary 1/K0 values: Mascot, MaxQuant, MS Fragger. My understanding is that Peaks is also searching ddaPASEF, but we have not seen example files yet. If you have any, we would love to see them, and if you have examples where outputs from the tools I have listed are not working in Skyline 19.1.9.338, we would love to see those also.
Thanks for being an early adopter and pushing forward on the ddaPASEF search pipeline you have working in your lab.
--Brendan
|
| |
| Brett Phinney responded: |
2019-12-04 14:47 |
|
| |
| Brendan MacLean responded: |
2019-12-04 14:56 |
It should! But I don't see it:
PrecursorMz ProductMz LibraryIntensity NormalizedRetentionTime GeneName ProteinId PeptideSequence ModifiedPeptideSequence PrecursorCharge ProductCharge FragmentType FragmentSeriesNumber TransitionGroupId TransitionId Decoy
Looks like old-style pre-PASEF format. Maybe check in with the Peaks folks about what they suggest. Any other output formats, like mzIdentML?
|
| |
| Brendan MacLean responded: |
2019-12-04 15:09 |
The 1/K0 values in MaxQuant are in the evidence.txt file. So, for PASEF data it is not enough to have just the msms.txt. In many cases, Skyline also likes to see the mqpar.xml file.
Thanks for testing and providing example files.
|
| |
| Brett Phinney responded: |
2019-12-04 15:11 |
|
| |
| Brian Pratt responded: |
2019-12-04 15:26 |
Looking in the "90 min run_PEAKS 3" directory it appears that the .pep file contains IM values.
Though, weirdly, the .p file contains this: "<ionmobility_type>none</ionmobility_type>"
|
| |
| Brett Phinney responded: |
2019-12-04 15:29 |
For the isolation scheme to use in skyline, Any suggestions? I attached the diaPASEF settings Brukerr gave me that I have been using.
|
|
| |
| Brendan MacLean responded: |
2019-12-04 16:00 |
Hi Brett,
I am working on fixing the "Import..." button in the Edit Isolation Scheme form for diaPASEF. It works on my machine now. The main issue is the order in which the m/z ranges show up in diaPASEF data. I have added a sort to the function that does the detection, but had to be careful to only do this for diaPASEF, because our multiplexed (staggered windows and MSX) depend on maintaining the order found in the data.
Anyway, works for both the isolation schemes I have. Yours looks like maybe:
400 425
425 450
450 475
475 500
500 525
525 550
550 575
575 600
400 425
425 450
450 475
475 500
500 525
525 550
550 575
575 600
Or, 8 x 25 m/z isolation ranges spanning 400 to 600 m/z (no margins). That means you have a dual-IMS isolation scheme, where the same m/z range is collected over 2 different 1/K0 ranges. I have a data set like this, but it is a full 32 x 25 m/z 400 to 1200 repeated twice over to 1/K0 range per m/z range. So, Skyline has been explicitly tested and has special code to deal with this type of isolation scheme. It was a bit of a surprise at first.
The other main dataset we have looks more like a traditional 32 x 26 m/z ranges from 400 to 1200 with 0.5 m/z margins and only one 1/K0 range per m/z range, which allows a full cycle every 8 tims trapping (since you get 4 ranges out of every times PASEF trapping). Not sure how long that takes, but if it were 200 ms, then you would get a 1.6 second cycle time.
If you get me a .d file (zipped) I can run my new code on it and see what it reports, but I suspect it will be what I have shown above.
Hope that helps.
--Brendan
|
| |
| Brendan MacLean responded: |
2019-12-04 16:01 |
Oops. Skyline would only need to know about 1 cycle of this, i.e.
400 425
425 450
450 475
475 500
500 525
525 550
550 575
575 600
|
| |
| Brett Phinney responded: |
2019-12-04 16:10 |
I'll send you a link with some DIA files I have been generating. It's not public so I can't post it on this message, unfortunately, or I totally would
You mind sending me your DIAParameters files if the format matches mine? Not sure if my version of the software is the same as yours. I'd really like to experiment with different windows, but I don't know where to start. I'd also like to see if I can make it work more like your chromatogram library approach you use over there....
|
| |
| 604293671 responded: |
2019-12-04 17:42 |
"Import..." Can be work in Skyline-daily 19.1.9.338. Spectrs libraries with RT and CCS value built from MASCOT dat file.The precursor ions and product ions can be extracted normal now.
It doesn't work when I set isolation scheme "Results (0.5 margin)" in skyline 19.1.0.193.
|
| |
| Brendan MacLean responded: |
2019-12-04 18:11 |
There is no support for diaPASEF in Skyline 19.1.0. You need to use Skyline-daily 19.1.9.338. I am still interested whether "Results (0.5 margin)" works in 19.1.9.338. I will try this myself soon. The "Import..." button will work in Edit Isolation Scheme will work in the next Skyline-daily release.
|
| |
| Brett Phinney responded: |
2019-12-05 09:51 |
Also anyone have any suggestions for the setting to use in the peptide settings tab (ion mobility predictor and Resolving power ) for Bruker timsTOF data? I'm still pretty new at this
Cheers
Brett
|
| |
| Brendan MacLean responded: |
2019-12-05 10:03 |
We are all probably still pretty new at this, but I did all of my initial analyses at 20 rp. After running optimization runs varying resolving power between 20-80 rp, I decided 50 rp might be optimal. It definitely produced many more detections than 20 rp. Though, the overall quantitative statistics produced by LFQBench (on 2 different 3-organism mixes) for those detections did seem to suffer slightly, likely just meaning that the added detections are of lower quality.
That's about the extent of what I know so far. Summary: 1) 20 rp works but is likely too wide, 2) 50 rp seemed optimal but may still be too narrow, 3) >50 saw noticeable quantitative disadvantage without gaining enough new detections to warrant the increase.
|
| |
| Brett Phinney responded: |
2019-12-05 10:12 |
Thanks! I'll try 50 and see how it goes
|
| |
| Brendan MacLean responded: |
2019-12-05 10:15 |
My Import button fix for diaPASEF works with one of your files I downloaded, but the isolation scheme is more extensive and more normal than what I saw in the DIAParameters.txt file you uploaded. It turns out to be:
400 425
425 450
450 475
475 500
500 525
525 550
550 575
575 600
600 625
625 650
650 675
675 700
700 725
725 750
750 775
775 800
800 825
825 850
850 875
875 900
900 925
925 950
950 975
975 1,000
1,000 1,025
1,025 1,050
1,050 1,075
1,075 1,100
1,100 1,125
1,125 1,150
1,150 1,175
1,175 1,200
So, no margin but 32 x 25 m/z ranges from 400 to 1200. I am not familiar with the DIAParameters.txt file and have never run or set up a timsTOF instrument. Nor do I have any Bruker instrument software installed besides the data reader DLLs they have given us to access the output files.
You can use this isolation scheme, or the next Skyline-daily will allow you to use the Import button yourself.
|
| |
| Brett Phinney responded: |
2019-12-05 10:22 |
Thanks! I still have no idea how to read that parameters file either. It's located in the .d directory under in the 421.m subdirectory in those files you downloaded. Let me know if you need any more data. Be glad to provide it
|
| |
| Brett Phinney responded: |
2019-12-05 10:35 |
if this helps, this is how Spectronaut is reading these windows. Looks like they overlap maybe ? 398-427 and 423-452 for example? I'll try and get some clarification from my Bruker contact
|
|
| |
| Brendan MacLean responded: |
2019-12-05 11:12 |
The isolation scheme I sent comes from 191106_DIA_S6_200ng_Slot1-78_1_318.d
Looking at the DiaFrameMsMsWindows table in the analysis.tdf SQLite file in this .d folder, I am completely convinced that the Skyline Import button is getting the right set of m/z ranges for this file.
Perhaps you are showing the isolation scheme for a different file in you attached JPEG. I would be happy to see if Skyline gets the same results with that file, and double-check the SQLite table in the analysis.tdf, which is really what matters in the end. That contains ground truth on this matter regardless of what anything else says. That is what the instrument actually recorded, as far as I understand.
|
| |
| Brett Phinney responded: |
2019-12-05 11:24 |
Yes, it's a different file, but I didn't change the MS method...at least I think...
Here is the file you are referencing.
|
|
| |
| Brendan MacLean responded: |
2019-12-05 13:11 |
I definitely disagree then with Spectronaut, then, on that file. I have attached the contents of the DiaFrameMsMsWindows table in an Excel spreadsheet with the added calculated columns for StartIsolationMz and EndIsolationMz. They match the ranges detected by Skyline with the Import button fixed. And the windows are repeated twice, indicating two different TIMS pushes (likely different 1/K0 ranges) and not the 4 shown in your JPEG. But the software could be further subdividing for performance reasons.
The isolation scheme you are showing, however, would end up getting treated as having 2 m/z margins, and Skyline would distinguish between what it considers the "Measured" windows and the "Extraction" windows. The Extraction windows for this would be the same as what I see in the DiaFramMsMsWindows table. And, I expect that Skyline and Spectronaut would treat this case in the same way in terms of chromatogram extraction. That is they would both treat the window:
398-427 as if only 400-425 were available for chromatogram extraction.
That is
Start = 398, End = 427, Margin = 2
is functionally equivalent to:
Start = 400, End = 425
For data analysis in Skyline. The "Margin" value would only come into play when calculating the "Measurement" windows for File > Export > Method or Isolation List. That is, when telling the instrument what to measure.
I suppose it may be that Spectronaut is reading something else that tells it that the instrument is using a 2 m/z margin in measuring the 25 m/z windows we see in the DiaFrameMsMsWindows table and the DIAParameters.txt.
|
| |
| Brendan MacLean responded: |
2019-12-05 13:13 |
|
|
| |
| Krawitzky responded: |
2019-12-05 13:55 |
Hi All,
Just saw this thread, but I will respond when I can (also will loop Stephanie into this convo).
For Brett's diaPASEF dataset, he is using
2 Rows of 8 PASEF scans (16 PASEF scans per cycle) x 4 steps per pasef scan = This is basically 2 x 8x4 Open Swath optimized window placement no m/z overlap (I havent yet tried an overlap of 0.5 or 1 da). However there is 1/k0 overlap
= total of 64 windows
This can be edited and is described in the diaPASEF user guide.
Michael
|
| |
| Brett Phinney responded: |
2019-12-05 14:13 |
|
| |
| Stephanie Kaspar responded: |
2019-12-09 02:05 |
Just a comment regarding Spectronaut:
That's a bug which will be fixed (using the 2 m/z margins).
Skyline is using the right isolation scheme with 400-425, and so on.
|
| |
 skyline maxquant ttp.jpg
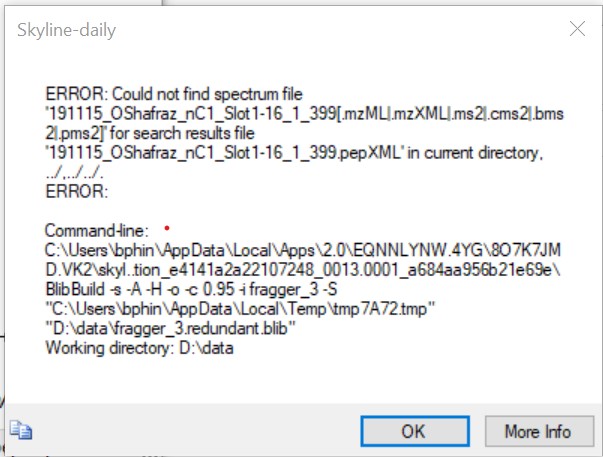 fragger_pepXML.jpg
 spectra library with CCS value.JPG
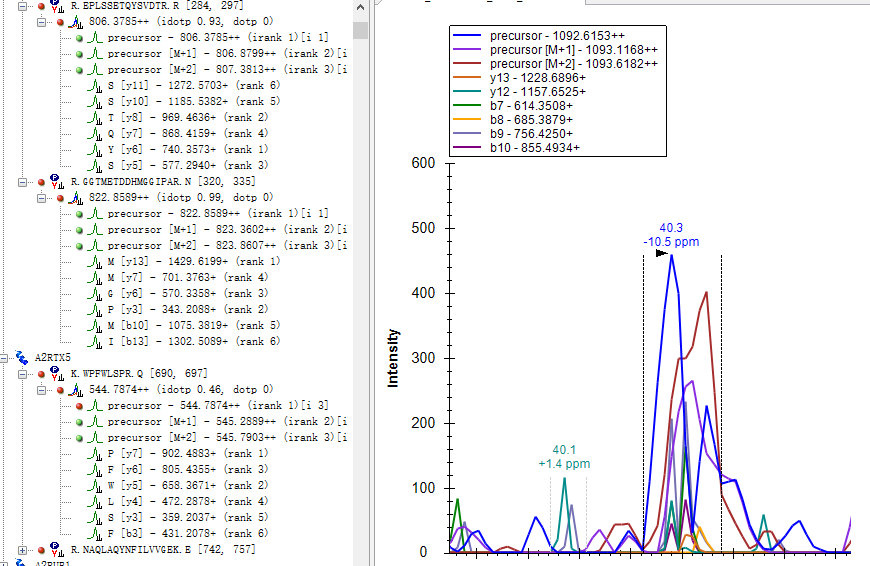 missing product ion.PNG
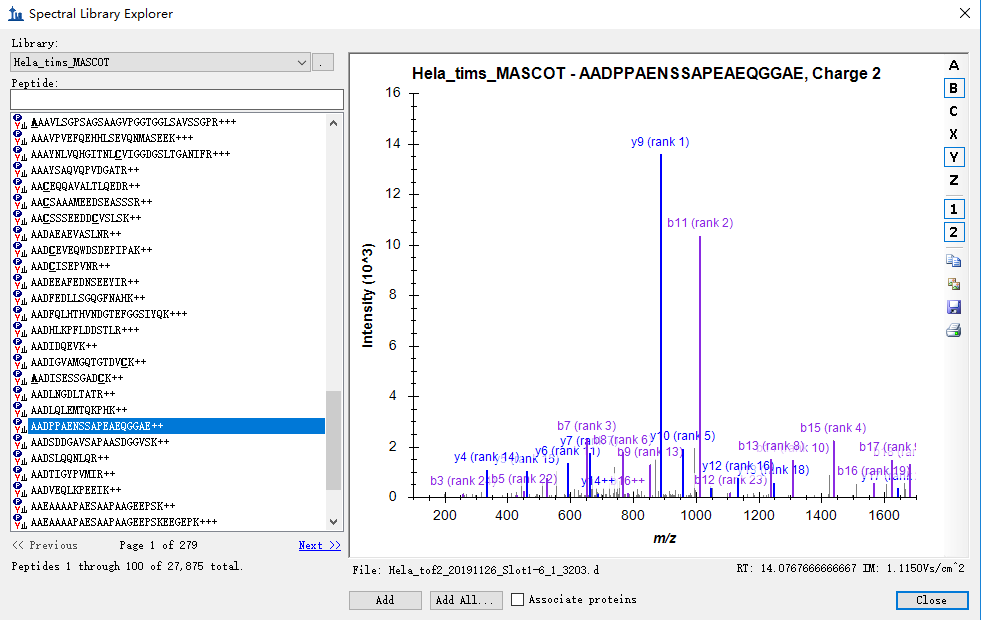 Spectra library.PNG
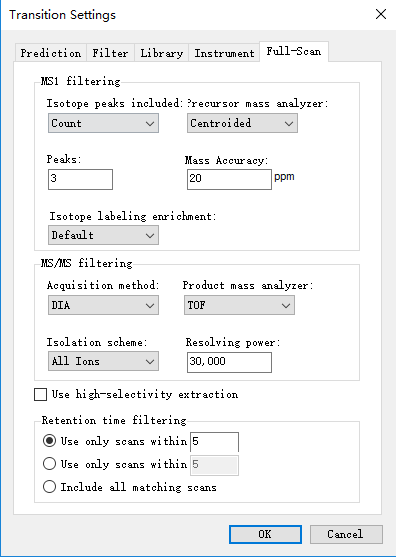 Full-Scan.PNG
 diaPASEF_windows_UCD.jpg
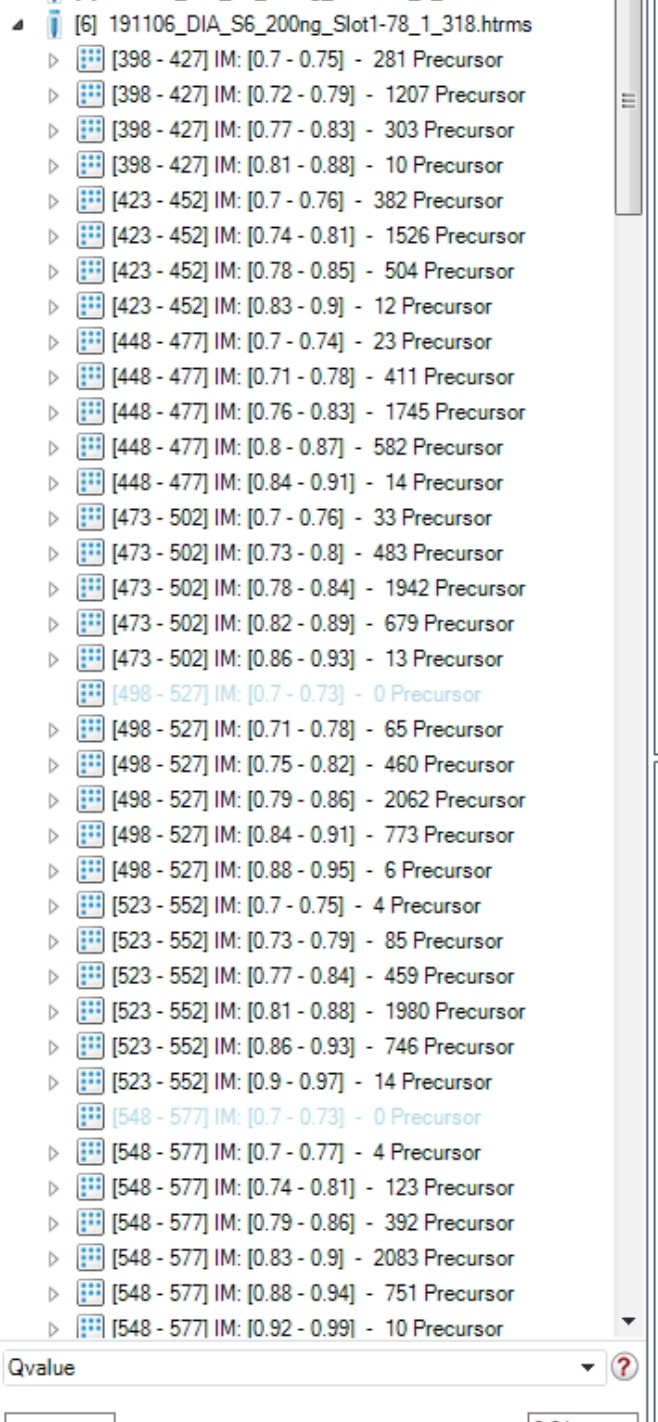 diaPASEF_windows_2_UCD.jpg