Hi Monica,
This appears to be quite old. Sorry that it went unanswered. From your screenshot, it looks like your Peak Areas - Replicate Comparison plot is only showing precursors. You can fix that by using right-click > Transitions > Products, or you could choose All and then use "Split Graph" to split the chromatograms into two panes showing both Precursors and Products separately.
It is unclear to me why your screenshot does not show the "Expected" isotope distribution for your precursor ions ("precursor", "precursor [M+1]", "precursor [M+2]"), but maybe you turned that off in your search for a bar labeled "Library". Usually, when you are viewing precursors, you would get "Expected" and when you are viewing products you would see "Library" if there is a corresponding library spectrum.
Hopefully, you have already worked this out long ago, but I thought I should at least respond. Sorry again this one got by us initially.
--Brendan
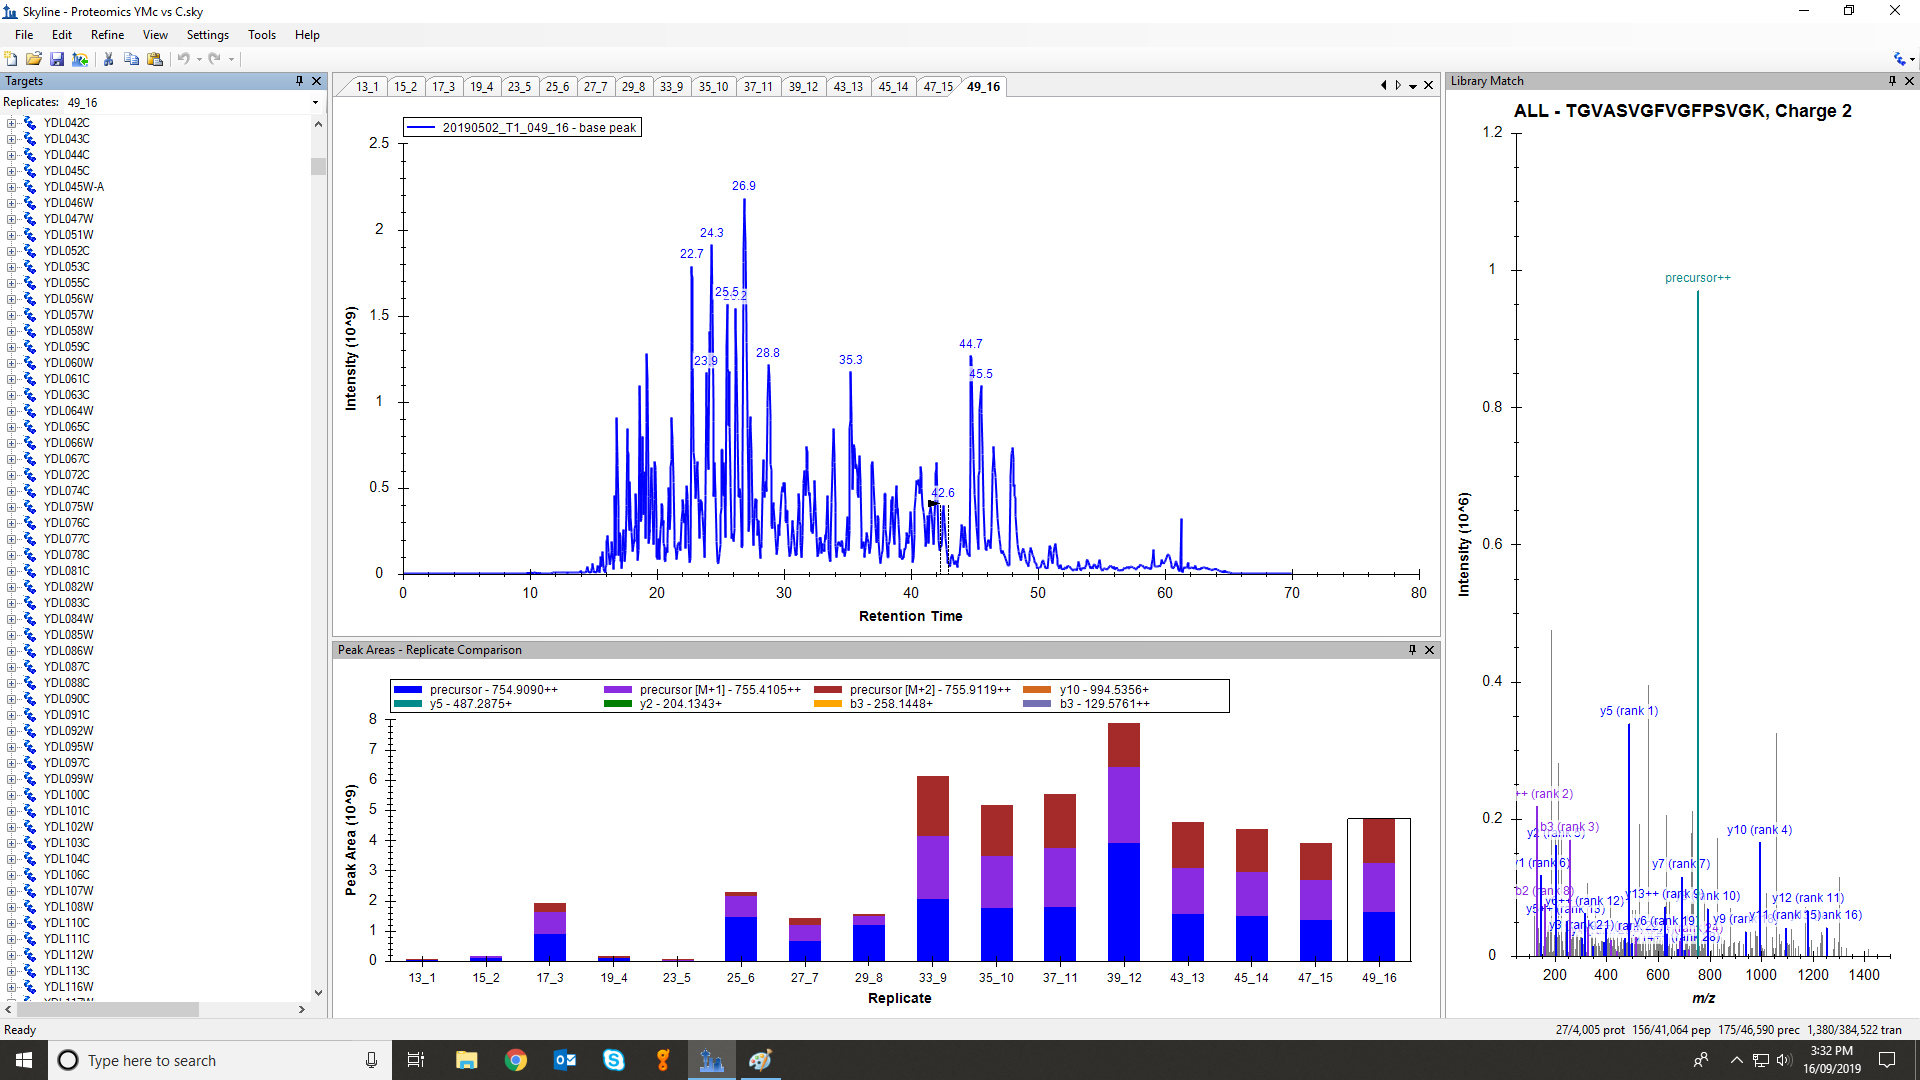 Skyline query.png