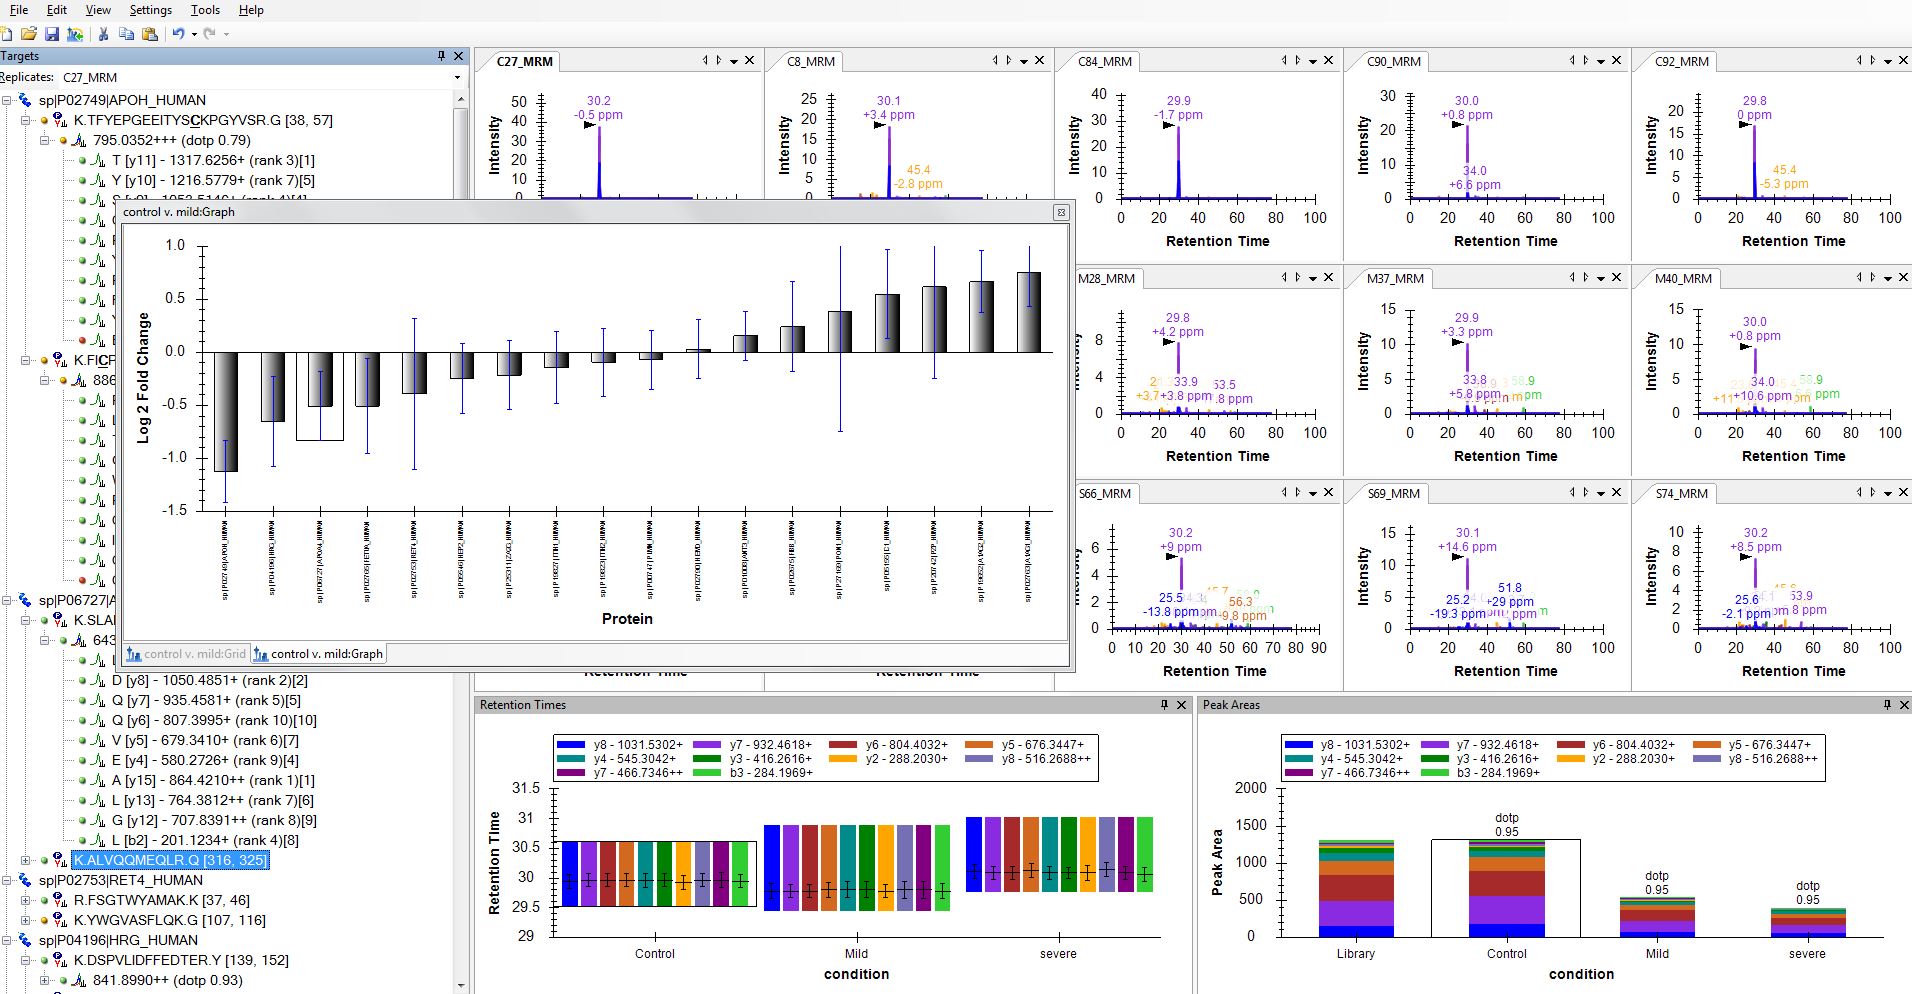
You need to switch to View > Transitions > Total, or you could switch to right-click > Graph Type > Line which should give you standard deviation whiskers on each separate transition. Though, that may be a bit confusing and may not be what you are looking for. If you are looking for the standard deviation of the total, then switch to Transitions > Total.
 result3.JPG