You should not be expecting these tools to produce the same numbers exactly, unless you are using some form of calibration. Instead, you should be comparing by linear regression and finding that they two tools have very high correlation. This will mean that a 2-fold change in abundance will produce a 2-fold change in peak area in both tools.
This was found to be the case in Navarro, Nat. Biotech 2016. No effort has been made on either side to produce matching raw peak area numbers.
Hope this help clarify what you should expect. I recommend reading Navarro, Nat. Biotech 2016 for insight on how to make the comparison.
—Brendan
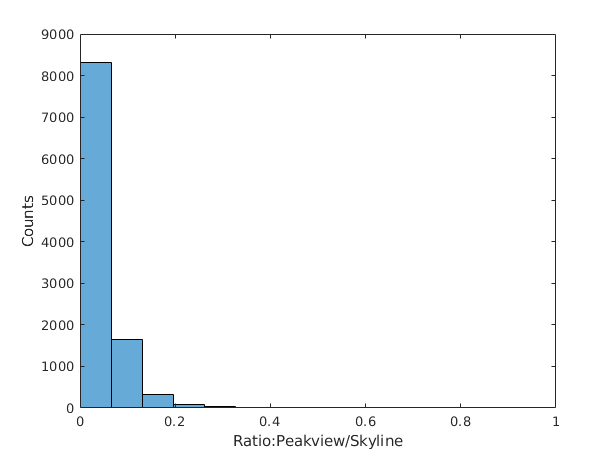 Ratio_PeakView_Skyline.png