| Brian Pratt responded: |
2015-09-15 10:58 |
Hi Jay,
There are still a lot of places in Skyline where we say "peptide" when we really mean "molecule". Have you tried using the molecule name there instead?
Could I possibly see the file you're trying to import?
Thanks
Brian Pratt |
| |
| jay kirkwood responded: |
2015-09-15 11:30 |
Hi Brian,
.csv file attached
Skyline is unhappy when I use a molecule name.
It seems to be expecting a peptide sequence
Thanks!
jay |
|
| |
| Brian Pratt responded: |
2015-09-15 11:58 |
Can I get the skyline doc (use File|Share to produce a .zip file) that goes with that?
Thanks
Brian |
| |
| jay kirkwood responded: |
2015-09-16 15:29 |
Yes attached
Thanks Brian!
jay |
|
| |
| jay kirkwood responded: |
2015-09-21 11:01 |
Hi Brian,
Just wanted to follow up to see if you have had time to look into using the "import peak boundaries" feature for small molecules.
Thank you!
Jay |
| |
| Brian Pratt responded: |
2015-09-21 14:12 |
Hi Jay,
That feature is, as you deduced, very attuned to working with peptides instead of general molecules.
I'm guessing that if the Explicit Retention Time value worked the way you wanted in the context of peak picking, you wouldn't be interested in using Import Peak Boundaries?
Thanks
Brian |
| |
| jay kirkwood responded: |
2015-09-21 14:19 |
Hi Brian,
I would actually still be very interested in the Import Peak Boundaries for small molecules.
The reason why is chromatography. For some small molecules, good chromatography is impossible (method dependent). The biggest issue perhaps is severe tailing, and in these cases, in my experience, skyline is unable to consistenlty integrate the entire peak.
We also have isomers that elute close together (10-20 % baseline separation) and when these peaks are low abundance, it is tough to always get the right one integrated.
Thanks,
jay |
| |
| Brendan MacLean responded: |
2015-09-21 14:38 |
Hi Jay,
Would you mind posting some screenshots as examples, and also giving us more information about where you expect to get the peak boundaries you wish to import? We'll try to help get the import peak boundaries feature working for you, but it has proved a somewhat dangerous feature in the past. In one case, a simple, custom integration tool really messed up a data set, then wasting a lot of time before the issue was noticed.
So, very curious what you had in mind. Thanks for sharing your thoughts.
--Brendan |
| |
| Brian Pratt responded: |
2015-09-21 14:55 |
Other thoughts:
It appears that the document is describing an isotope distribution, with the same precursor name repeated but with monotonically increasing mz values. Those name collisions cause some internal problems. I'd be curious to see the original file that you used to populate the Skyine document tree, most likely a CSV file used with "Edit|Insert|Transition List".
Thanks
Brian |
| |
| jay kirkwood responded: |
2015-09-21 14:58 |
Hi Brendan,
Thanks for your rapid response!
Please see attached powerpoint. It shows an example of inconsistent integration windows for citrate, sample to sample.
The peak shape is nothing short of terrible, however, I have found that when I fully integrate the peak (9-12 min) I get very consisitent flux data. That is, the ratio of the isotopically labeled peaks to the total peak area is very consistent.
Just out of my general curiosity, would you be able to give a bit more detail on the dangers you have seen with the peak boundaries feature? The main danger I could think of initially was perhaps a peak shifting in retention time, but only in a treatment group, leading to artificial and significant changes between groups.
For this reason, I do plan on following up the data anlysis with visual QCs of the data. It would just streamline our integration efforts significantly.
Thanks!
jay |
|
| |
| jay kirkwood responded: |
2015-09-21 15:08 |
Hi Brian,
I may be wrong, but it sounds like you are referring to my other open request here regarding skyline.
If not, please correct me.
If so, then please find the attached excel file with the flux SRMs for glutamate and glutamine, where you can see some SRMs are identical parents and precursors.
I don't use the file > import > transition list.
Instead I use the edit > insert > transition list.
This way I can just paste in the transitions. Do you recommend importing instead?
Thanks!
jay |
| |
| jay kirkwood responded: |
2015-09-21 15:09 |
now it is attached |
|
| |
| Brian Pratt responded: |
2015-09-21 15:54 |
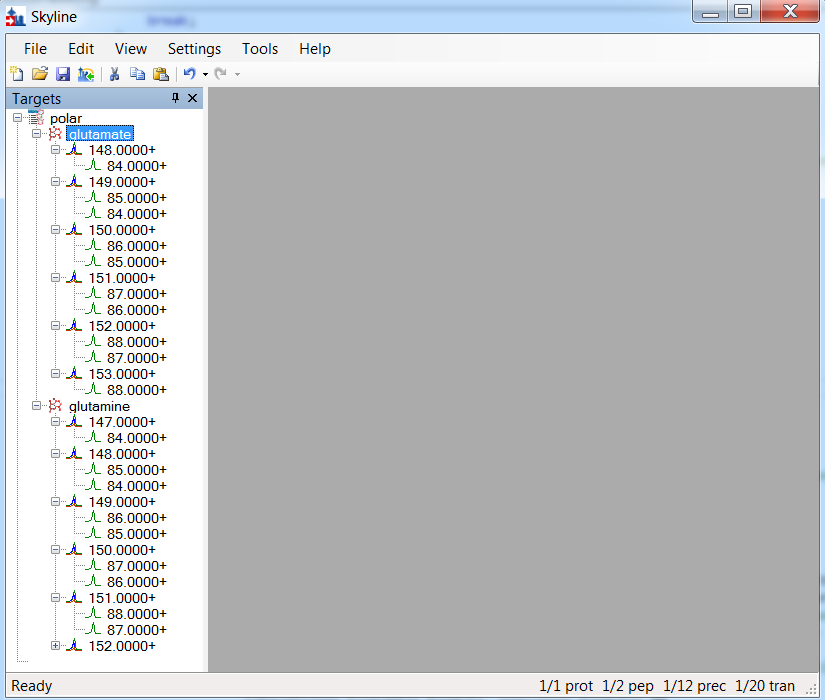
Very useful, thanks. Skyline was doing a poor job of importing this - see the attached image for the proper representation. This will be in the next Skyline-Daily. |
|
| |
| jay kirkwood responded: |
2015-09-23 10:28 |
I will be on the lookout for the next release.
Thank you Brian!
jay |
| |
| Brian Pratt responded: |
2015-09-23 12:23 |
I'm curious about that data - it looks like it's describing an isotopic distribution, but is it really the case that you want a different set of products for each of those precursor masses? That's a new idea for Skyline. What is the shape of the document tree you would expect? What Skyline gives you at the moment is a bunch of molecules all with the same name but different masses, that's probably not what you had in mind.
Thanks
Brian |
| |
| jay kirkwood responded: |
2015-09-23 18:42 |
Hi Brian,
This is metabolic flux dataset, for kinetic flux profiling of central carbon metabolism.
When we replace the cell culture media, we replace with an isotopically labeled nutrient. In this case, it is uniformly labeled 13C-glucose.
Since it is inappropriate to assume which labeling patterns may or may not occur, it is good practice to monitor for all potential labeling patterns. This means that, even though we monitor for a precursor with lets say 3 carbons that are 13C, we must account for the fact that those carbons may or may not end up in the product ion. Therefore, for a molecule that has 4 carbons and its fragment has 2, the transition list would look like:
parent = 4 carbons, fragment = 2 carbons
SRM = 100 > 50
parent = 3 13C carbons, fragment may have 1 or 2 13C carbons
SRM = 103 > 51
SRM = 103 > 52
I'm not particular about how the tree looks, and for my purposes, a single molecule name with several different SRM transitions (including different precursor ions) is actually ideal.
Thanks!
jay |
| |
| Brian Pratt responded: |
2015-09-25 11:58 |
OK, on reflection Skyline probably is representing that data correctly. You'd want to use the "Label" column in the importer to express the idea that these are all the same thing but with different labels. Without that information it's necessary for Skyline to treat them as different items. Which in your case you don't mind, so this is already good to go I think.
Thanks
Brian |
| |
 tree.png