Dear Brendan:
First, thanks for developing such a nice software for targeted proteomics.
Second, got some questions about the group comparison:
1. We are focusing on the protein level instead of peptide level, so how did Skyline define the intensity for the protein? Does it simply add up all the intensity of peptides from same protein?
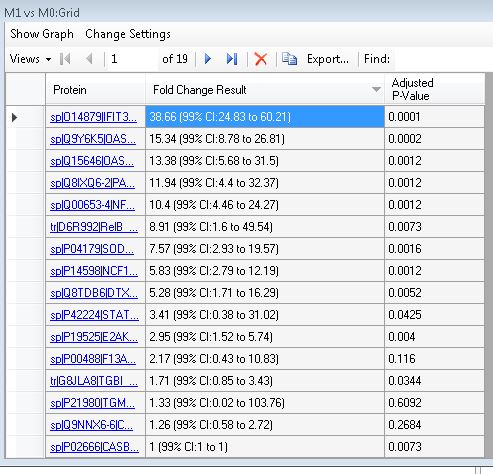
2. Take the first protein from the attachment for example, in the "fold change result" what does 38.66(99%,CL:24.83 to 60.21) mean? I assume 38.66 is the mean of the fold change from 3 repeats (I have done the 3 biological repeats) and 99% means 99% confident level.
3. Can I get the ratio for the 3 different repeats instead of median?
Thanks a lot for your help.
Cheers
Enzo |
| |
| Nick Shulman responded: |
2015-08-12 00:35 |
1. Yes, the protein intensity is the sum of the peptide intensities.
2. The fold change is calculated by doing a linear regression. The x-coordinate is equal to 0 or 1 depending on whether the replicate was a control or a case. The y-coordinate is the log base 2 of the intensity for that replicate. Skyline then fits a straight line through those points. Raising 2 to the power of that slope gives the fold change of the cases over the controls.
If you have technical replicates (i.e. you specified an "Identity Annotation"), those technical replicates get averaged together, so the number of points on the graph is the number of biological replicates.
When the fold change says "38.66(99% CI:24.83 to 60.21)", that means that the average intensity of the cases are approximately 38 times higher than the controls, and 24.83 to 60.21 is the 99% confidence interval.
If you take the log2 of everything, it also means that the slope of the line was 5.27 with the 95% confidence range +/-.64.
3. We do have plans in the future to expose this protein level intensity, which would make it easier for you to calculate the pairwise ratios. For now, I would recommend doing this calculation in Excel. You can use the Document Grid to export the "Total Area" for all of the Precursor Results in your document, and use Excel to group those by protein and sum them.
Hope this helps! |
| |
| Enzo responded: |
2015-08-12 19:08 |
Dear Nick:
Thanks a lot for the quick response and clarifying.
I'll export them into spreed sheet and do the comparison. Waiting for the new release will include the protein level intensity.
Best
Enzo |
| |
| roman sakson responded: |
2019-09-22 13:01 |
Dear Nick,
I have decided to respond to this old thread instead of opening a new one, as I have quite similar questions:
1) Is it still the case that protein values are the sum of peptide values for this protein (is it also the case if transitions are not summed up but a TMP is applied, so that TMP-based peptide values are then summed up)?
2) Am I right assuming that first the light protein value is calculated and then, if normalization to heavy is applied, this light value is divided by the heavy protein value which is calculated as the light one but based on heavy signal intensities? Then the normalized protein value would be log-transformed etc.
3) Is there any way to make Skyline export protein-level values by now? Especially when applying the TMP, this might be very helpful!
Thanks for all these features in Skyline!
Roman |
| |
| Nick Shulman responded: |
2019-09-24 16:03 |
Roman,
If Skyline is doing Tukey median polish, then the transition peak areas do not get summed. The individual peak area values are the thing that Tukey median polish is applied to.
If you have not chosen a normalization method, then Skyline will add up all of the transition peak areas except those whose precursor's Isotope Label Type is an Internal Standard. You control which Isotope Label Types are Internal Standards with the setting at:
Settings > Peptide Settings > Modifications > Internal Standard Type
If you are Normalizing to heavy then the protein abundance is calculated as the sum of all of the light transition peak areas divided by the sum of all of the heavy transition peak areas.
No, there is no way to see these protein abundance values. I will look into how hard it would be to make that information something that you would be able to display in the Group Comparison grid.
-- Nick |
| |
| roman sakson responded: |
2019-10-02 16:00 |
Thank you! |
| |
|
|
 Capture.JPG