| Nick Shulman responded: |
2022-06-24 10:22 |
The resolution or mass accuracy settings that you have specified at "Settings > Transition Settings > Full Scan" tell Skyline how wide of an m/z channel to sum across when extracting chromatograms. For this reason, the mass error that Skyline reports is never going to be an amount that is wider than that channel. Also, if you wanted to tell Skyline to ignore signal which is outside of that mass accuracy window, you should change the resolution or mass accuracy so that it is not that wide.
When Skyline is calculating the total mass error for a chromatogram peak, Skyline averages the mass errors for the individual spectra along the peak. These averages are weighted by the observed intensity in each spectrum. It is possible for these mass errors to cancel each other out, if the mass error in one spectrum is a negative number, and the mass error in a different spectrum is a positive number. It is conceivable that this sort of cancellation might be happening in your example.
I might be able to give you a better answer if you send me your .raw file. If that .raw file is less than 50MB you can attach it to this support request. You can upload larger files here:
https://skyline.ms/files.url
I would expect that disagreements that you are seeing between Skyline's mass errors and your other software might come from the fact that when Skyline is calculating mass errors, Skyline only considers the portion of the signal which falls within the m/z channel that is indicated by the resolving power that you have specified in your Transition Full Scan settings. You might get better agreement between these numbers if you told Skyline that your mass analyzer is "Centroided". When the mass analyzer is centroided, Skyline asks the mass spectrometer vendor software to figure out how much of the profile signal to look at, and how that signal should be averaged in order to decide what m/z is represented by the observed signal.
-- Nick |
| |
| Nick Shulman responded: |
2022-06-24 10:51 |
I just noticed that you have the checkbox "Triggered chromatogram acquisition" checked at "Settings > Transition Settings > Instrument".
It is recommended that you leave that checkbox unchecked unless you really are doing a SureQuant method where you are telling the mass spectrometer to only start collecting particular MS2 spectra as soon as it sees some other sort of signal.
When that checkbox is checked, Skyline uses different algorithms to integrate peak areas, most importantly, Skyline does not do background subtraction.
It also looks like there might be a bug, and that Skyline is reporting the mass error as zero, even though the mass error is supposed to be a different number.
If you uncheck that checkbox and then do "Edit > Manage Results > Rescore", then I think you will see the correct mass errors on the peaks.
I will figure out what Skyline is doing wrong when "Triggered chromatogram acquisition" is checked.
-- Nick |
| |
| jrenders responded: |
2022-06-24 10:51 |
Hi Nick,
Thanks for your response. I don't understand how the resolving power and mass analyzer type under "Settings > Transition Settings > Full Scan" dictates an MS1 ppm mass tolerance extraction threshold? Can you explain that more? I see an m/z filter in the "Filter" tab of this window, but specifying m/z is not convenient when analyzing signals at multiple different masses, a ppm threshold is much more useful. Can you elaborate more on this?
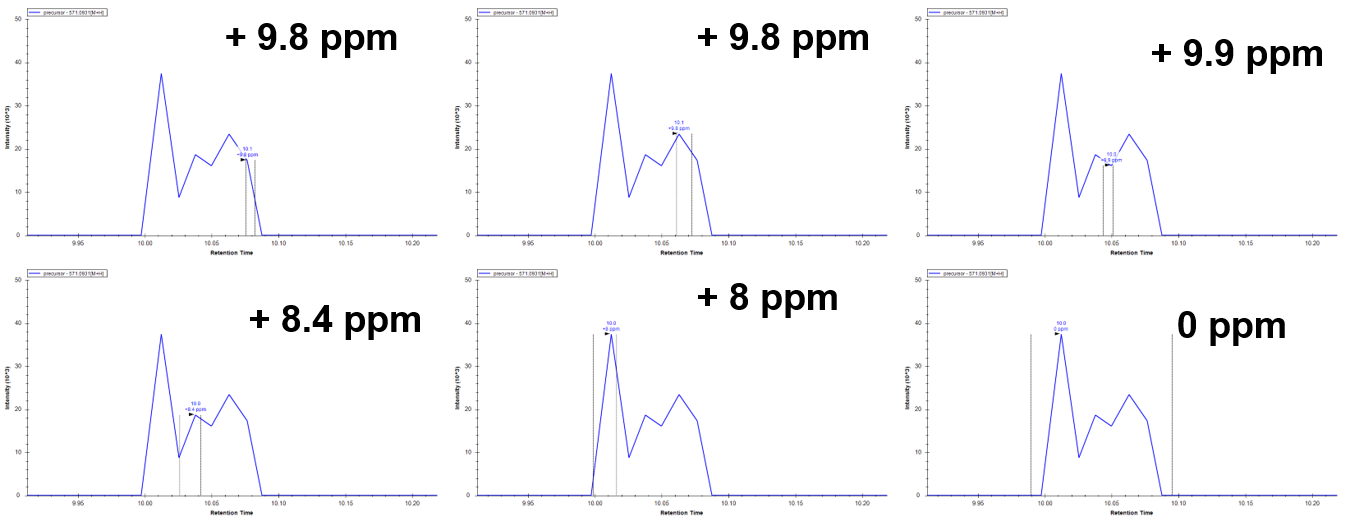
I thought at first that perhaps there were some opposing MS1 signals that canceled out the ppm mass error to bring it back to 0, but when I select any small section of the peak, all sections are +8 and above. There are no negative ppm signals to support this theory.
I have uploaded the raw file of the sample to the url you provided. Thanks. |
|
| |
| jrenders responded: |
2022-06-24 11:02 |
|
| |
| Nick Shulman responded: |
2022-06-24 11:31 |
Thank you for sending that raw file.
Yes, there is a bug in Skyline. The bug is that if the chromatogram intensity at either the start or end of the peak is zero, and you have "Triggered Chromatogram Acquisition" checked, then the reported mass error will be zero.
The reason that this is happening is that Skyline ends up trying to divide some number by zero, which ends up being "not a number", which later on causes the reported mass error to be zero.
I will fix try to fix this bug in the next update of Skyline-Daily.
-- Nick |
| |
| jrenders responded: |
2022-06-24 11:47 |
Great, good to know. Thanks Nick! To close the loop can you explain a little more about ppm mass tolerance on MS1 chromatogram extraction or can you point me to a link about how this is handled in Skyline? It is still pretty unclear why Skyline is even showing me signals that are 9ppm off or how to reduce that to 5ppm for example. Also unclear why the reported mass error is so off compared to what it should theoretically be (showing 9ppm when it's really about 28ppm)? Thanks! |
| |
| Nick Shulman responded: |
2022-06-24 12:15 |
If you click on a point along the chromatogram, Skyline will bring up the "Full Scan" viewer which will show you the m/z channel that Skyline summed across when extracting that chromatogram point (see attached picture).
For this particular chromatogram point, Skyline only looked at the part of the spectrum which is contained in that blue shaded rectangle. Skyline figured out what the weighted average was for the intensities which were inside of that blue rectangle, and Skyline came up with an m/z value which was inside of, and close to the right edge of that blue rectangle (I would guess 571.095).
The other software that you were using probably looked at the whole peak that we can see there and saw that its center was probably closer to 571.108.
-- Nick |
|
| |
| jrenders responded: |
2022-06-24 12:46 |
Thanks Nick, that makes sense. It seems then that it would behoove me to have that blue rectangle be larger so that Skyline can properly interpret the apex of the mass peak and assign a more accurate ppm mass error. What governs the blue rectangle width? Thanks! |
| |
| Nick Shulman responded: |
2022-06-24 12:58 |
The width of the blue rectangle is determined by the resolution or mass accuracy setting that you have specified at:
Settings > Transition Settings > Full Scan
There is a complicated formula for converting from resolving power to blue rectangle width, and the exact formula depends on the mass analyzer.
Also, if you check the "Use high-selectivity extraction", then the blue rectangle ends up being half as wide as it otherwise would be. Checking the "Use high-selectivity extraction" checkbox is generally equivalent to doubling the number in the "Resolving power" textbox.
-- Nick |
| |
| jrenders responded: |
2022-06-24 13:13 |
Thanks so much Nick, this is great info. This issue of calculating the ppm mass error of a signal based on all mass signal within the blue window (rather than determining the ppm mass error based on the apex of the peak [even if it is outside the blue window]) causes us a lot of consternation because of numerous exact mass false positives. We will think about how to resolve this (pun intended), perhaps centroiding as you said earlier...Thanks again! |
| |
 Picture1.png
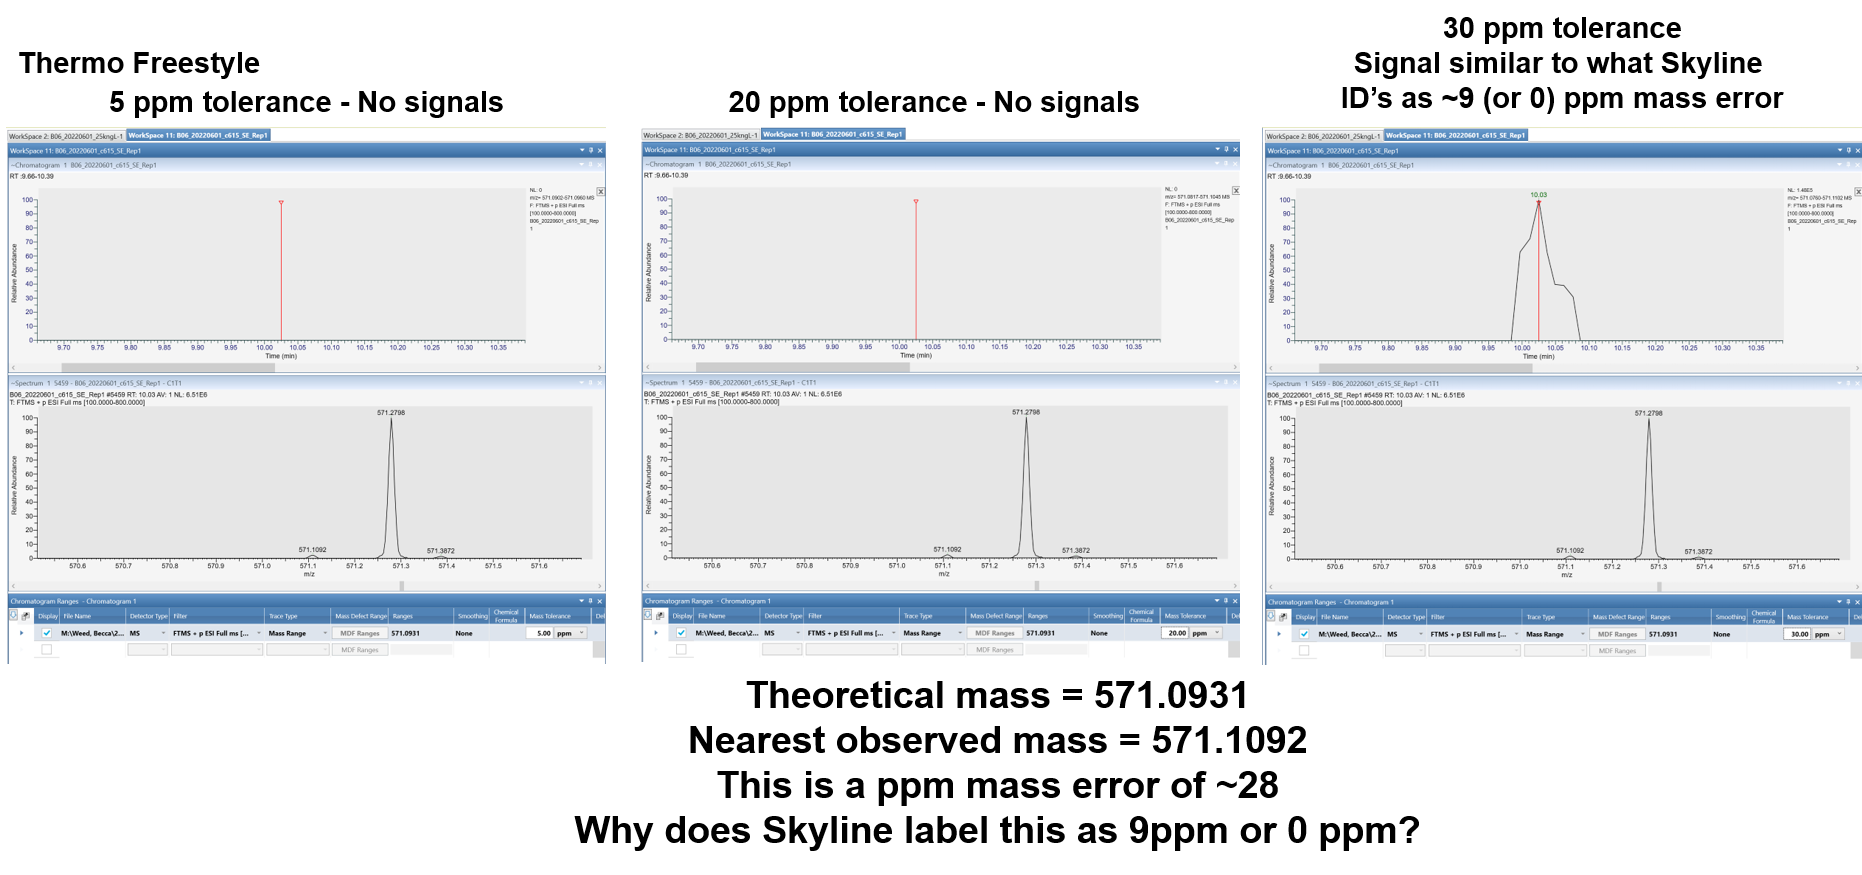 Picture2.png
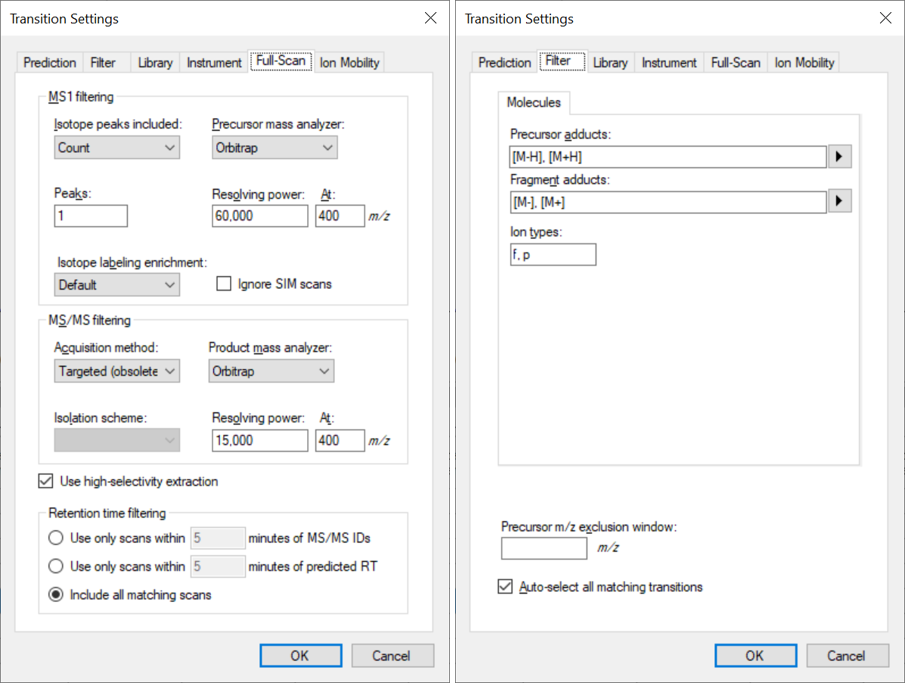 Settings.png
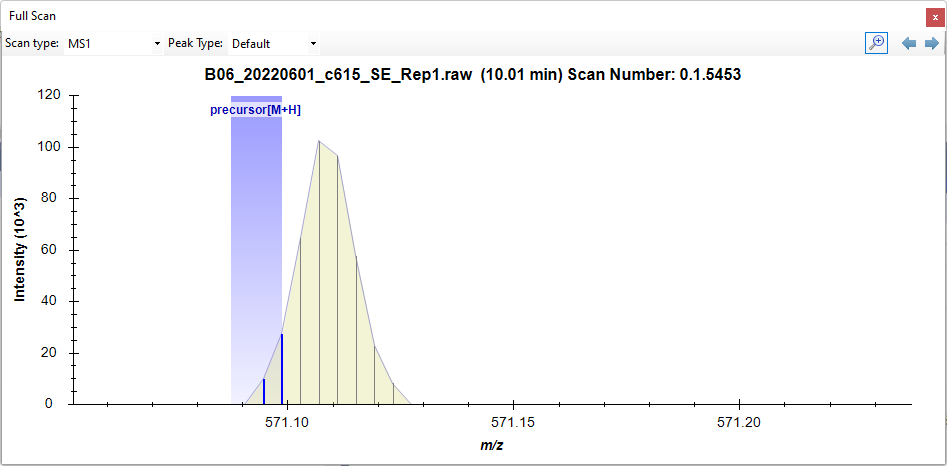 ChromatogramExtrationWindow.png