| |
| Nick Shulman responded: |
2021-09-30 10:28 |
You should remove the columns "Mean Area", and "Area" from your report.
Those columns are coming from the Transition Results Summary, which means that your report will have one row per transition, so the ends up multiplying the rows in your report by the number of transitions per peptide.
After you remove those columns, the number of rows in your report will be closer to the number of peptides times the number of replicates.
The columns "Detection Q Value", "Detection Z Score" and "Total Area MS1" are on the Precursor Result, so they may cause you to have more than one row per peptide if some of your peptides have more than one charge state in your document.
By the way, the "Transition Results Summary" set of columns are a great way to see statistics across all of the replicates in your document. However, if you need to see statistics across subsets of the replicates (like seeing the CV across replicates grouped by concentration), then I recommend using the Pivot Editor. Here is the help page for the Pivot Editor:
https://skyline.ms/wiki/home/software/Skyline/page.view?name=PivotEditor
-- Nick |
| |
| heyang responded: |
2021-09-30 10:43 |
Hi Nick,
thank you very much for your help. All runs were from different samples. How can I build up report to quantitatively compare peptides include peptide, their fragments?
thanks,
Heyi |
| |
| Nick Shulman responded: |
2021-09-30 11:35 |
If you want to get one number per peptide, then the column that you should use is called "Normalized Area".
It can be found in the Report Editor at:
Proteins > Peptides > Peptide Results > Quantification > Normalized Area
The Normalized Area uses the normalization method specified at "Settings > Peptide Settings > Quantification".
If that normalization method is "None", then the Normalized Area typically ends up being the sum of all of the transition peak areas for that peptide.
If you want to compare the numbers across groups of replicates (e.g. "Healthy vs Diseased") you should take a look at the Group Comparison tutorial:
https://skyline.ms/wiki/home/software/Skyline/page.view?name=tutorial_grouped
-- Nick |
| |
| heyang responded: |
2021-10-01 05:43 |
Thank you very much, Nick and Have a good day. Heyi |
| |
| heyang responded: |
2021-10-05 07:23 |
Hi Nick,
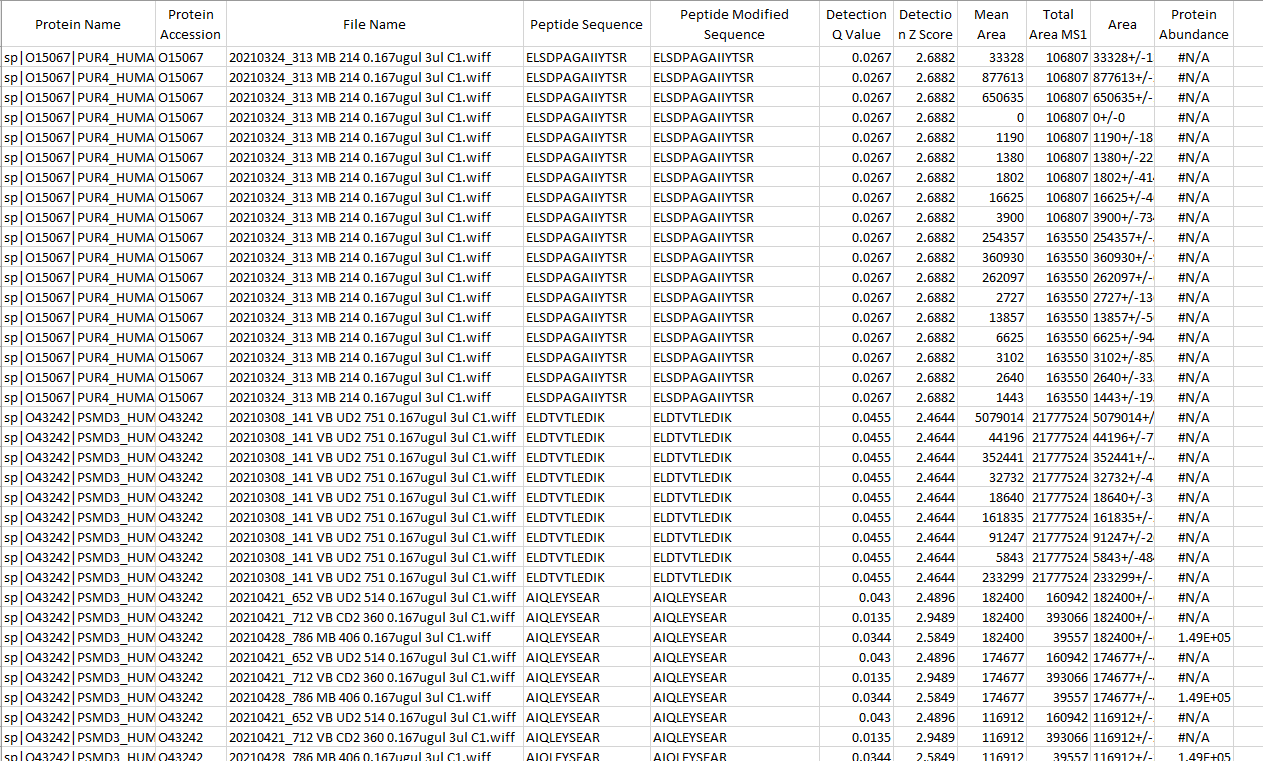
I followed your advice to export quant results. As you see attached, why protein area is lower than peptide area?
thanks,
Heyi |
|
| |
| Nick Shulman responded: |
2021-10-05 07:51 |
If your protein has only one peptide in it, I believe the Protein Abundance usually ends up being equal to the Peptide Normalized Area divided by the number of transitions in the peptide.
This depends on the Normalization Method that you have chosen at "Settings > Peptide Settings > Quantification", but, I believe, for most of those normalization methods, the Peptide Normalized Area effectively ends up being the SUM of the transition peak areas, and the Protein Abundance ends up being the AVERAGE of the transition peak areas. That is, if you multiply the Protein Abundance by the number of transitions, I think you will get a number equal to the Peptide Normalized Area.
The Peptide Normalized Area and the Protein Abundance are not intended to be compared with each other. Those numbers are only considered valid for comparing between replicates in the document within the same peptide or protein. You should never compare the Normalized Area of two different peptides and draw any conclusions as to how the quantities of those two peptides compare to each other.
I might be wrong about how these numbers are calculated. If you send me your Skyline document I can give you more information about how Skyline is getting the numbers that it is.
In Skyline you can use the menu item:
File > Share
to create a .zip file containing your Skyline document and supporting files including extracted chromatograms.
If that .zip file is less than 50MB you can attach it to this support request. Otherwise you can upload it here:
https://skyline.ms/files.url
-- Nick |
| |
| heyang responded: |
2021-10-05 08:54 |
Thank you, Nick and I know the reason. Our skyline file is huge including almost 200 lc runs. zip files is bigger than 52 G, is it still ok to upload it? Heyi |
| |
| Nick Shulman responded: |
2021-10-05 09:48 |
Yes, feel free to upload files as large as you would like.
I am not sure whether it's worth it to upload such a large file for this particular question, but I imagine you have other questions about this document which will be easier for us to answer after we see it.
-- Nick |
| |
| heyang responded: |
2021-10-06 07:49 |
Hi Nick,
I upload out file which name "B and MB Col1". Thanks,
Heyi |
| |
| heyang responded: |
2021-10-07 12:33 |
Hi Nick,
One more question about multiple SWATH sample process or single sample process. Just realize that Q value will be different if we process different multiple samples (like 50 vs 5) . What should we do? Process sample one by one, or as a batch. If as a batch process, how many samples we should process one time?
thanks,
Heyi |
| |
| Nick Shulman responded: |
2021-10-07 13:05 |
Heyi,
I do not know the answer to your question. Maybe somebody else on this support board does.
I know some people have put a lot of thought into what to do about q-values when you have multiple replicates.
I know Skyline has some graphs that show you how many peptides were detected in at least X number of replicates. You can see those graphs if you look at the menu item:
View > Detections
In some sense, I believe you should be using the best q-value for a particular peptide across all of the replicates, but someone with a better knowledge of statistics could probably give you a more correct answer.
-- Nick |
| |
| heyang responded: |
2021-10-14 05:41 |
Morning Nick,
One more question is for some peptide, we see very good shape and good Q vale, much lower than 0.05. But the area showed N/A. Total there are around 1% peptide showed normalized area is not available. Could you help on this?
Thanks,
Heyi |
| |
| Nick Shulman responded: |
2021-10-14 06:01 |
The Normalized Area will be #N/A if that peptide has missing or truncated transition peak areas in that particular replicate. A truncated peak is one where the peak boundary is at the edge of the chromatogram extraction window.
Skyline tries to make sure that if the Normalized Area has a value, that it makes sense to compare that value between replicates.
If the area for a particular transition is truncated or missing in one but not all of the replicates, then the Normalized Area ends up being #N/A in the replicate where a transition area is missing.
That's the most likely reason that some of the Normalized Area values are #N/A.
-- Nick |
| |
| heyang responded: |
2021-10-14 08:39 |
Thanks, Nick. looks peak which normalized area not showed don't have missing or truncated transition peak , see attached pic. Only highlighted sample don't have peak area. All others don't have problem. I uploaded the data days ago, could you help check the data?
Heyi |
|
| |
| Nick Shulman responded: |
2021-10-14 13:12 |
Heyi,
The reason that the Normalized Area ends up being #N/A for that peptide in that particular replicate is that the y6 transition has a "truncated" peak.
A truncated peak is a peak whose boundary is at the end of a chromatogram.
There is a column "Truncated" available in the Document Grid which will tell you which transitions have truncated peaks. (There is a search button (looks like binoculars) on the top of the Report Editor which will help you find a column by name).
In the attached screenshot, it's not clear to me why the predicted retention time is so close to the right edge of the chromatogram that was extracted. In your settings at "Settings > Transition Settings > Full Scan" you have told Skyline to extract a chromatogram which extends 5 minutes on either side of the predicted retention time, so I would have expected the chromatogram to be centered around that predicted line in the screenshot.
I am thinking that your iRT predictor must be different than what it was when you extracted the chromatograms. If you have made changes that affect the chromatogram extraction parameters, it might be a good idea to tell Skyline to extract the chromatograms again by going to:
Edit > Manage Results > Reimport
-- Nick |
|
| |
| heyang responded: |
2021-10-15 10:58 |
Thank you, Nick.
We use endogenous peptides for retention time calibration. Initially we use 10 min window MS/MS ID to extract chromatograms. After that, 200 peptides from results were selected as rt marker to calibrate rt. Then go to " Setting>Transition setting>full scan" to select 10 min Window of predicted rt.
We didn't go reimport chromatograms.
When I try to do Edit>Manage Results>Reimport today, it told me calibration is failed, so no chromatograms is extracted. However, when I do rt calibration, it showed success. Why it showed me Fail when I reimport chromatogram?
Best,
Heyi |
| |
| Nick Shulman responded: |
2021-10-15 18:18 |
When you have an iRT predictor, Skyline first extracts chromatograms for just the iRT peptides.
Then, Skyline chooses peaks for those iRT peptides.
Skyline then does a linear regression between the retention time where each iRT standard peptide was found, and the iRT score that has been assigned to the peptide. If the R value of that linear regression is less than 0.99, then Skyline discards peptides one by one until the R value of the linear regression is greater than 0.99.
If Skyline has to discard more than 20% of the iRT standard peptides in order to get a linear regression with a R value that is greater than 0.99, then the linear regression has failed and Skyline will not extract chromatograms for the rest of your peptides.
The way to figure out what went wrong is to go to:
View > Retention Times > Regression > Score to Run
and then right-click on that linear regression graph and do all of the following:
1. Choose Calculator > <name of your iRT calculator>
2. Choose Replicates > Single
3. Choose Points > Standards
4. Click the "Set threshold..." right-click menu item and enter "0.99"
Then, in Skyline select the replicate that you are having trouble with. On the regression graph, the peptides that had to be thrown out will be shown in a lighter purple. You can click on those purple points and Skyline will select the corresponding peptide in the Targets tree.
In your document, I see that you have 200 iRT standards. If some of your iRT standard peptides are difficult to detect at their appropriate location, you might want to remove them from the list of standard peptides. To do that, go to:
Settings > Peptide Settings > Predictions > Calculator button > Edit Current
then push the "Choose Standards" button, and there will be a big textbox where you can remove standard peptides from the list. When you remove a standard peptide from that list it becomes a normal peptide, and it will appear in the lower grid on the Edit iRT Calculator dialog.
-- Nick |
| |
|
|
 Skyline ourput question.png
 Skyline output question Quant.png
 Skyline pep area question.png
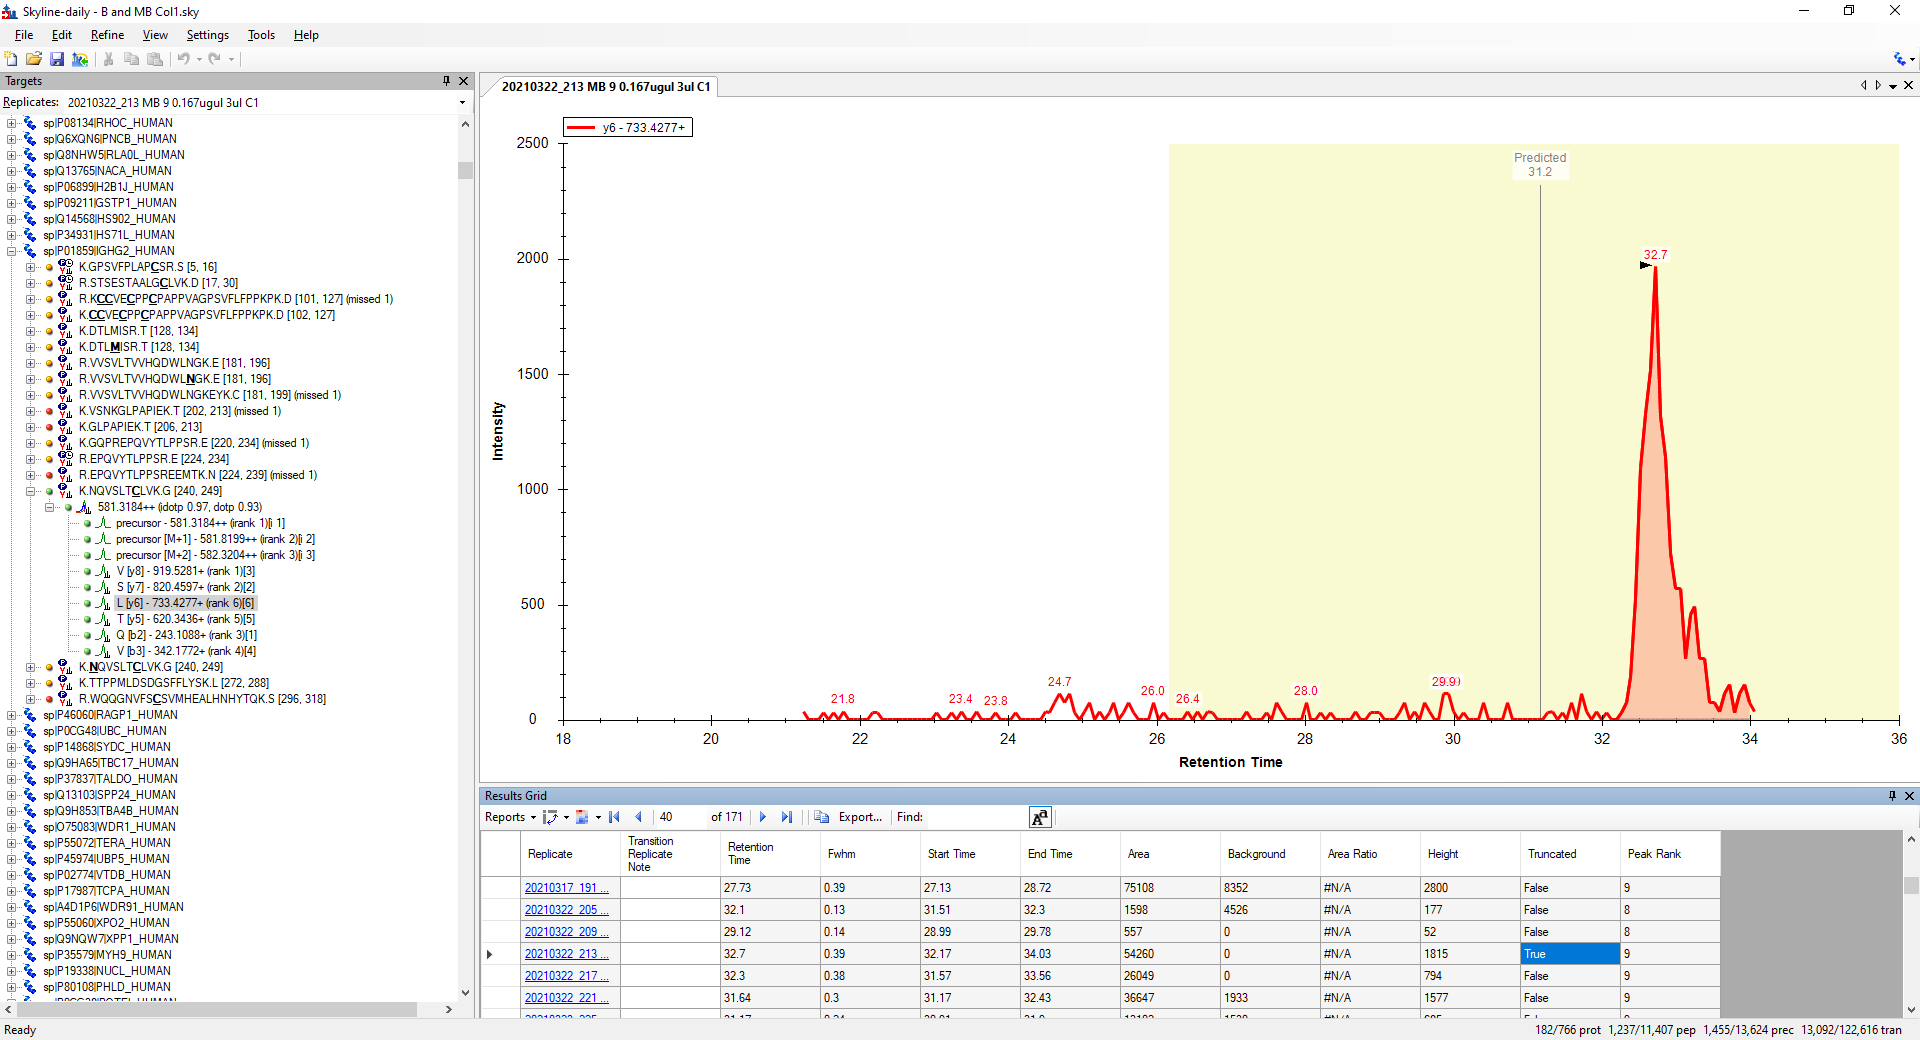 truncated_y6.png