Dear Support Team,
I was using Skyline for analyzing an MRM based data and also using a spectral library. During analysis, for some of the peptides, I noticed that the dotp value shown in 'peak area view' and that in 'target window' are different. However, for most of the other peptides, it is same at both the places.
Could you please help me understand the problem. Looking forward to hearing from you.
Attached here is the screenshot for the same.
Regards
Mehar
 peak area.JPG
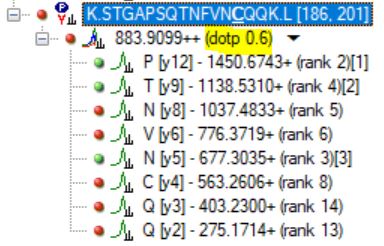 target window.JPG