Roman,
The reason that the CVs are so high in your CVs_Transitions.jpg is that in each of those two groups, there is one replicate whose value is zero.
I am not sure what is going on with those zero replicates. When I look at their chromatogram those replicates show "Chromatogram information unavailable".
The inclusion of these zero values in the CV calculation in the Peak Area Replicate Comparison window causes the CV to be a high number.
These zero values do not end up getting included in the Group Comparison calculation.
I am not sure exactly why the peak area graph decided to include these two replicates, and the group comparison does not include them.
It might be that the more relevant question is why your data looks the way it does. Do you know what is going on with the replicates U_POMT1_III and ALG1_I?
-- Nick |
Nick,
thank you for your answer. This is true, for the two replicates U_POMT1_III and ALG1_1 the peptide in question was not included in the transition list, I added it later on. So, there is simply no data available. From my understanding for data analysis, it is correct not to include these zero values in the Group Comparison calculation and instead to influence the statistical outcome by substracting 2 degrees of freedom, which, I assume, Skyline does correctly.
I guess, what made me ask in the Support Board was the fact that the Peak Area Replicate Comparison plot itself treats these values differently, depending on whether Transitions are set to "All" or to "Total" and I was not sure, whether this is a bug.
Thank you,
Roman |
 Volcano_Plot.jpg
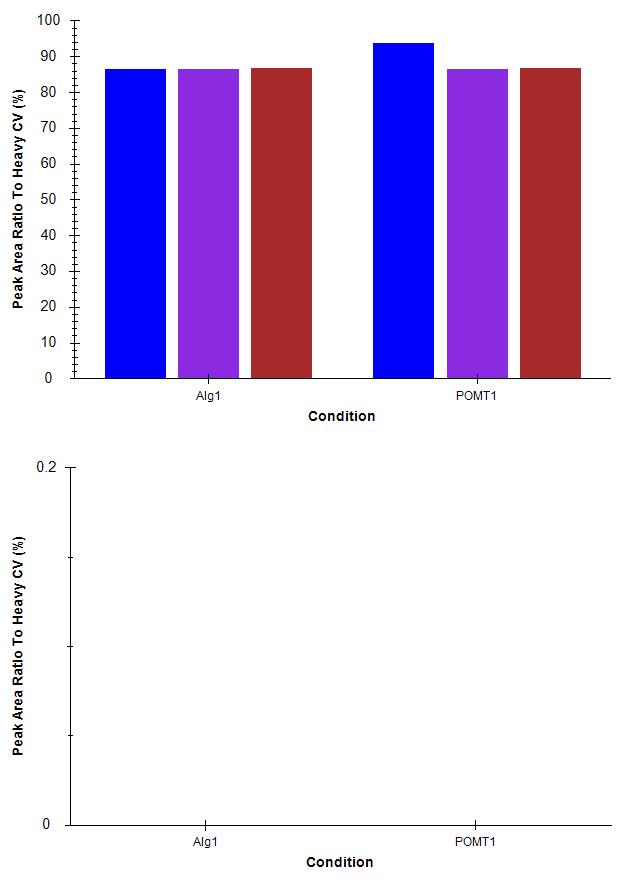 CVs_Transitions.jpg
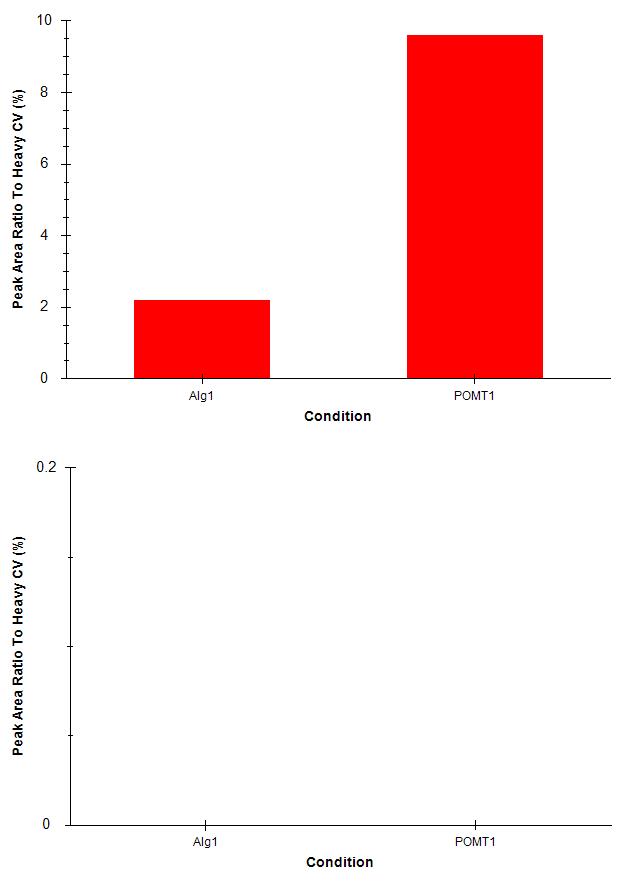 CVs_All.jpg
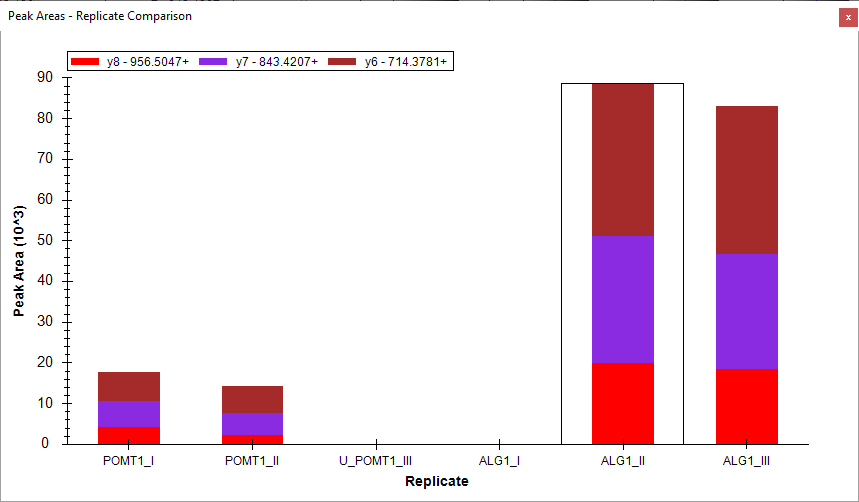 PeakAreas.png