| Nick Shulman responded: |
2020-05-12 14:39 |
Can you send us your spectral library "20200429_Neat_Plasma_HPRP_DDA_SL_MSFragger.blib"? It was not included in the set of files that you uploaded.
In general, it is best to use the Skyline menu item "File > Share" to create a .zip file containing your Skyline document and its supporting files including extracted chromatograms and spectral libraries.
-- Nick |
| |
| Max McCabe responded: |
2020-05-12 15:20 |
Sorry for the issue, I have reuploaded the full zip as recommended with the title "Scaffold Support Upload II"
Thanks,
Max |
| |
| Nick Shulman responded: |
2020-05-12 17:37 |
Max,
What information do you have about how many of your peptides should be detectable in these files?
When I go to:
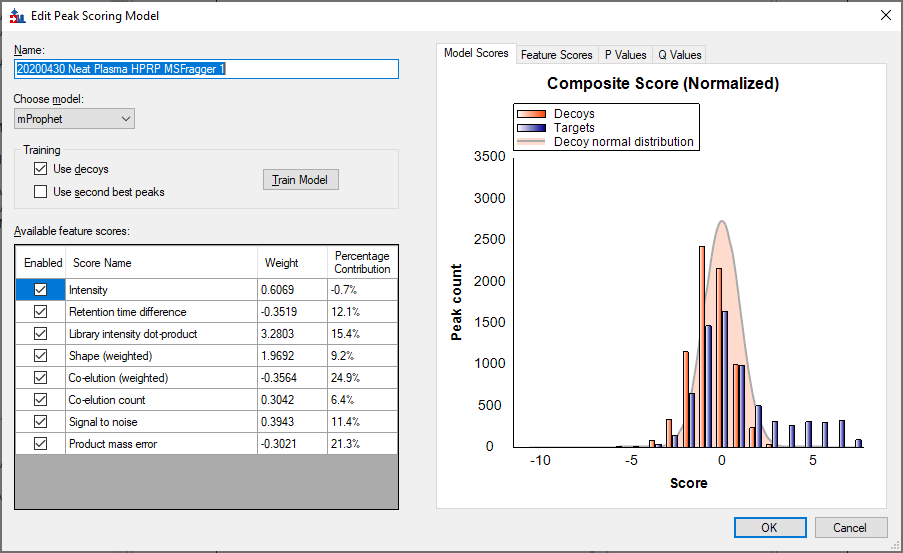
Refine > Reintegrate > Edit Current
I get the attached picture.
It is true that the scores for the majority of your targets overlaps with the decoy scores, but there is a definite population of peptides that got scores that were much better than any decoys.
If you want to examine which peptides got the best scores, you should tell Skyline to reintegrate using your trained model. You do this by going to:
Refine > Reintegrate > OK.
Then, you can use the "Detection Q Value" to find the peptides with the lowest Q Values.
300 of your peptides had a Q value in at least one replicate that was below 1%.
100 of your peptides had a Q value below 1% across all of the replicates.
(The next version of Skyline will have more features for filtering on q-values, but for now you have to use the Pivot Editor. )
How many peptides did you expect to be able to find in this data?
-- Nick
|
|
| |
| Max McCabe responded: |
2020-05-13 08:12 |
Nick,
That is also what I'm seeing when I run the scoring model and look at identified peptides. I expect that far more peptides should be able to be identified from this data, as the same files when searched against a similarly generated SL in PEAKS result in ~5500 peptide IDs with ~4700 unique sequences across the 6 samples at a score cutoff well above what PEAKS considers to be 0% FDR to filter manually for what look like high quality spectral matches. Of note, if I import this same library directly from PEAKS and use it in the same Skyline template I have uploaded, I receive similar results to what I see with the MSFragger library.
Additionally, data generated with DDAPASEF on these same samples around the same time reveals multiple thousands of unique peptide IDs when processed with both PEAKS and MSFragger, making it seem strange that there would be such a reduction with DIA acquisition.
I can't see why there would be such a large difference between software packages so I still feel like there is something wrong with the way I have my Skyline document set up.
Thanks again for your assistance!
Max |
| |
| Nick Shulman responded: |
2020-05-13 10:58 |
Max,
Can you send us at least one of your raw data files?
We are thinking that maybe IMS filtering window is not centered on the actual ion mobility of your peptides.
When you have the raw data files you can click on the points along the chromatogram and Skyline will bring up the Full Spectrum viewer. You can see whether the ion mobility filter that Skyline is applying looks right.
-- Nick |
| |
| Max McCabe responded: |
2020-05-13 14:09 |
Nick,
Sure, I have uploaded a zipped raw file with the description "Skyline Support Plasma Raw File". I tried taking a look myself but I'm unsure if the filter looks wrong or if I'm just not familiar with the interface.
Max |
| |
| Brian Pratt responded: |
2020-05-13 15:11 |
Hi Max,
I had a look and it does seem like the CCS values aren't a great fit (see attached screen shot). Do you know how they were derived? We saw a lot of slightly-off CCS values when other software packages were first adopting timsTOF, I wonder if you just need to update something in your pipeline.
Thanks
Brian Pratt |
|
| |
| Max McCabe responded: |
2020-05-14 14:03 |
Brian,
Looking through the data now it does seem like that is the problem for a pretty significant subset of the peptides! I'm not sure where the IM filtering windows were derived, is this a problem that is likely to have occurred during library generation? Or could it be an acquisition problem that is causing Skyline to choose the wrong filtering window? I am loading raw .d files directly so there is nothing upstream on that end.
Thanks again!
Max |
| |
| Brian Pratt responded: |
2020-05-14 15:16 |
Hi Max,
When I say upstream I mean what kind of search results did you feed to Skyline for library generation?
Cheers
Brian |
| |
 MaxMcCabePeakScoringModel.png
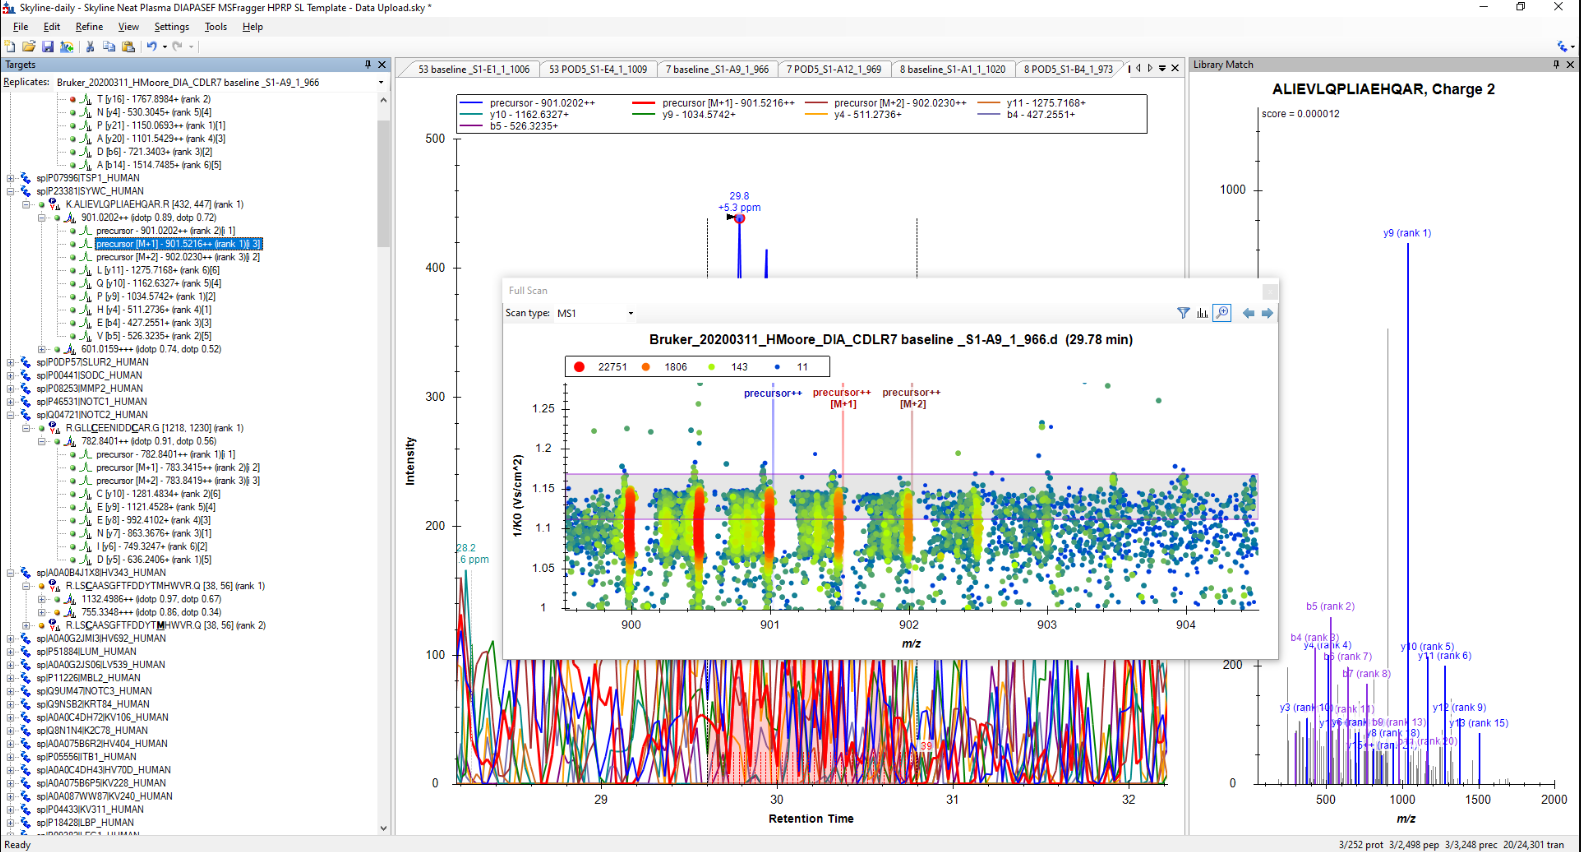 Capture.PNG