That thread is probably not applicable here, because you are expecting to see 493 showing up 2.5x the height of 79, and it is essentially missing instead. So, there clearly is not the expected linear relationship.
I would generally start by clicking on the chromatogram to look at the underlying spectra that have produced the chromatograms you see in Skyline. Though, I can't do that without the raw data files, you still could. It might become immediately obvious what is going on.
My first (wild) guess would be that your 240,000 at 200 resolving power produces too narrow an extraction width (a.k.a Full Scan Filter Width in the reports or results view), which is 0.000413 for 79 and 0.000645 for 493.
Kind of makes me realize that when resolving power is that high, the extraction width really needs to include both resolving power and mass accuracy. You may be able to resolve to 0.5 PPM, but your mass accuracy still is likely not up to supporting a 1 PPM extraction window.
I would be surprised if relaxing your resolving power somewhat doesn't improve what you are seeing.
--Brendan
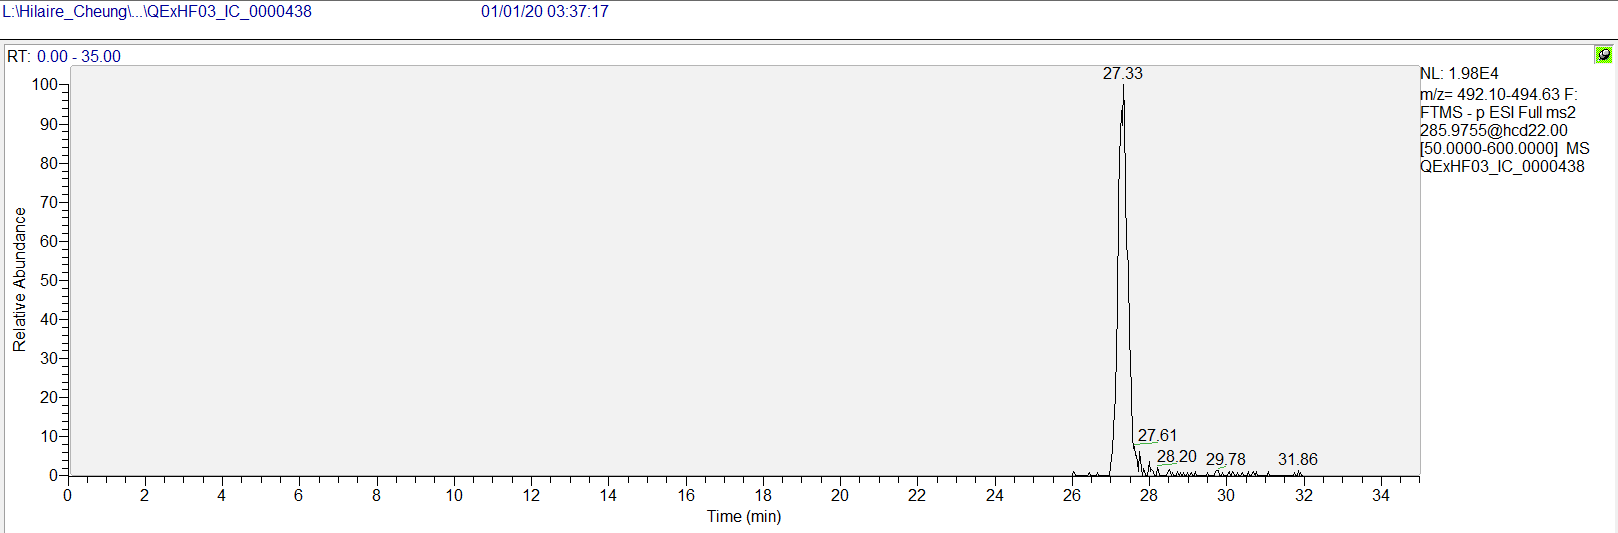 QExHF03_438 493 XIC.PNG
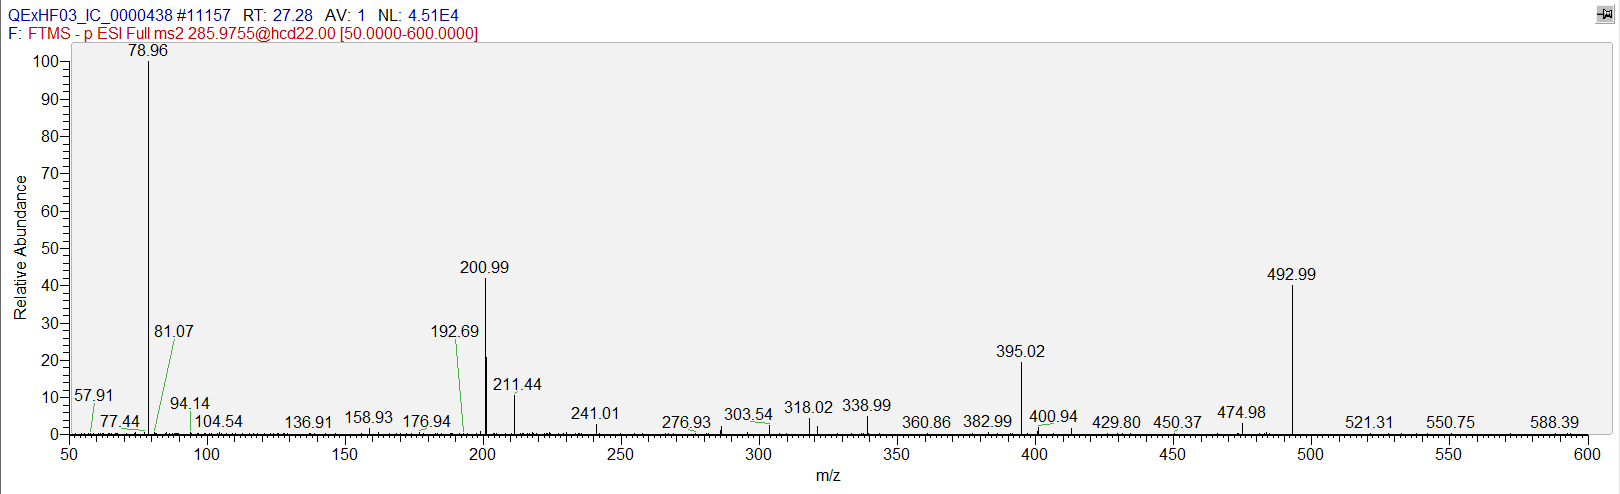 QExHF03_438 286 MSMS.PNG
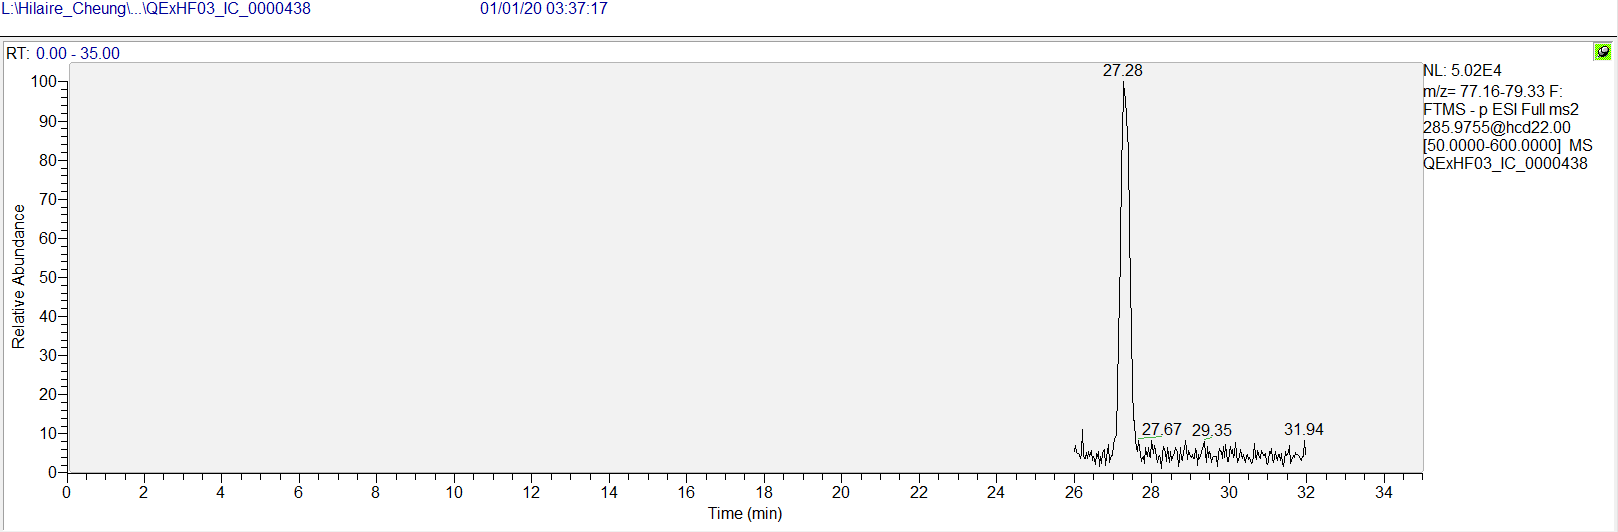 QExHF03_438 79 XIC.PNG
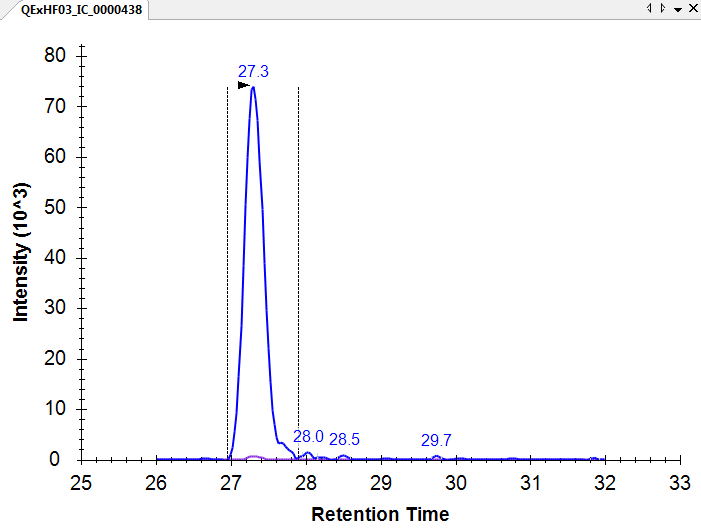 QExHF03_438 Skyline XIC.PNG
 Transition setting.PNG