issues of peak area under the curve

support
issues of peak area under the curve zongtao  2018-11-07 09:05
 

hi, skyline team
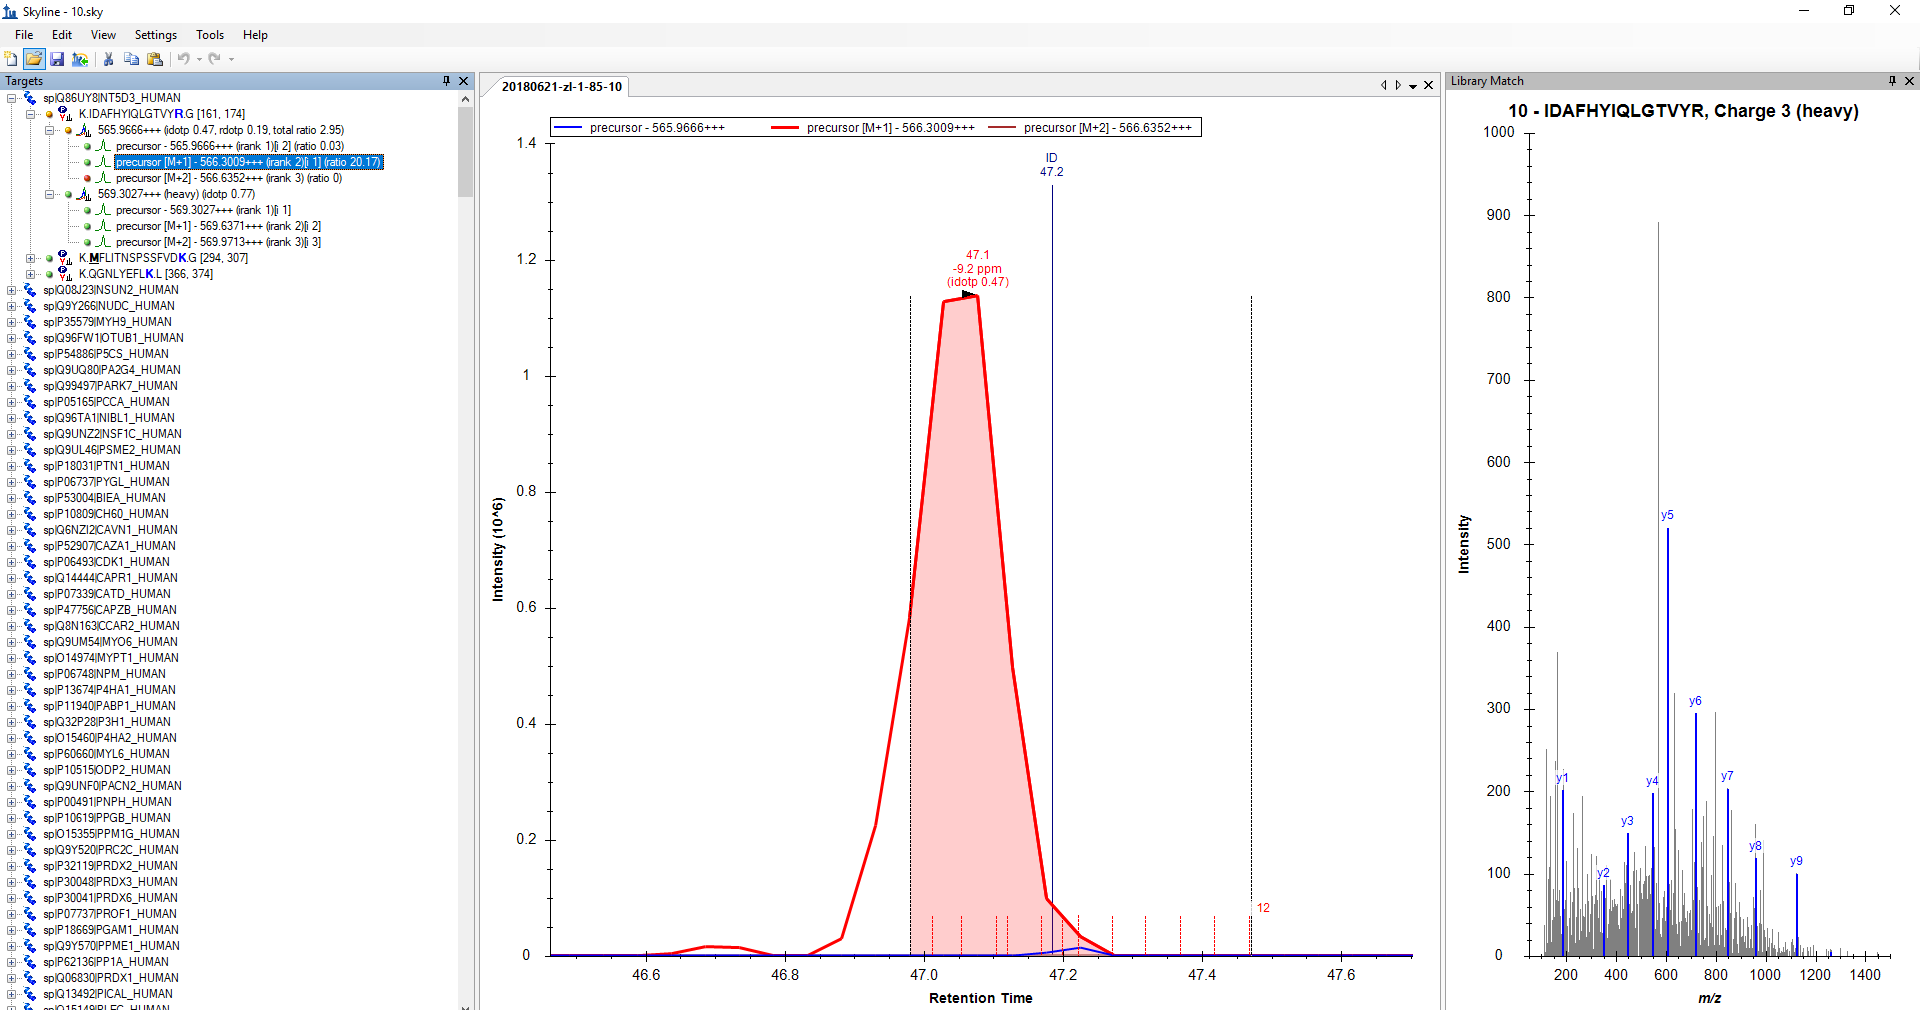
see attached figure showing that the the peak area counted is not the real peak area we want. how can we better the extraction method? a minor question is: what is the "12" in the figure, where it is coming from? i noticed that this number is associated with the extracting time window, and this number changes with different peptides.
thanks,


Nick Shulman responded:  2018-11-07 13:50
The number 12 there is the number of points on the chromatogram between the start and end of the integration boundary. (i.e. "points across the peak").

The reason that Skyline chose that tiny little blue peak is that there was an MS2 identification in your peptide search results at that time. This is shown on the graph by that vertical line with the text "ID 47.2".
That probably is the correct peak for that peptide, but there is probably some other interference which causes the M+1 chromatogram to be much larger than the monoisotopic chromatogram.
You might get better results if you discard the M+1 chromatogram for this particular mass.
To remove the peak for one particular mass, first use the menu item:
View > Transitions > Single
so that you are only looking at the chromatogram for the currently selected transition.
Then, right-click on the chromatogram and choose:
Remove Peak > precursor [M+1]...

Does that answer your question?
-- Nick