| aaron robinson responded: |
2018-09-24 17:42 |
Can anyone comment on this?
|
| |
| Brendan MacLean responded: |
2018-10-04 10:14 |
We have not done the work to prove the validity of doing this, but I have heard of it being done successfully. We make no guarantees.
It is probably worth a try to see how it works for you.
--Brendan
|
| |
| anatoly.urisman responded: |
2019-02-18 15:44 |
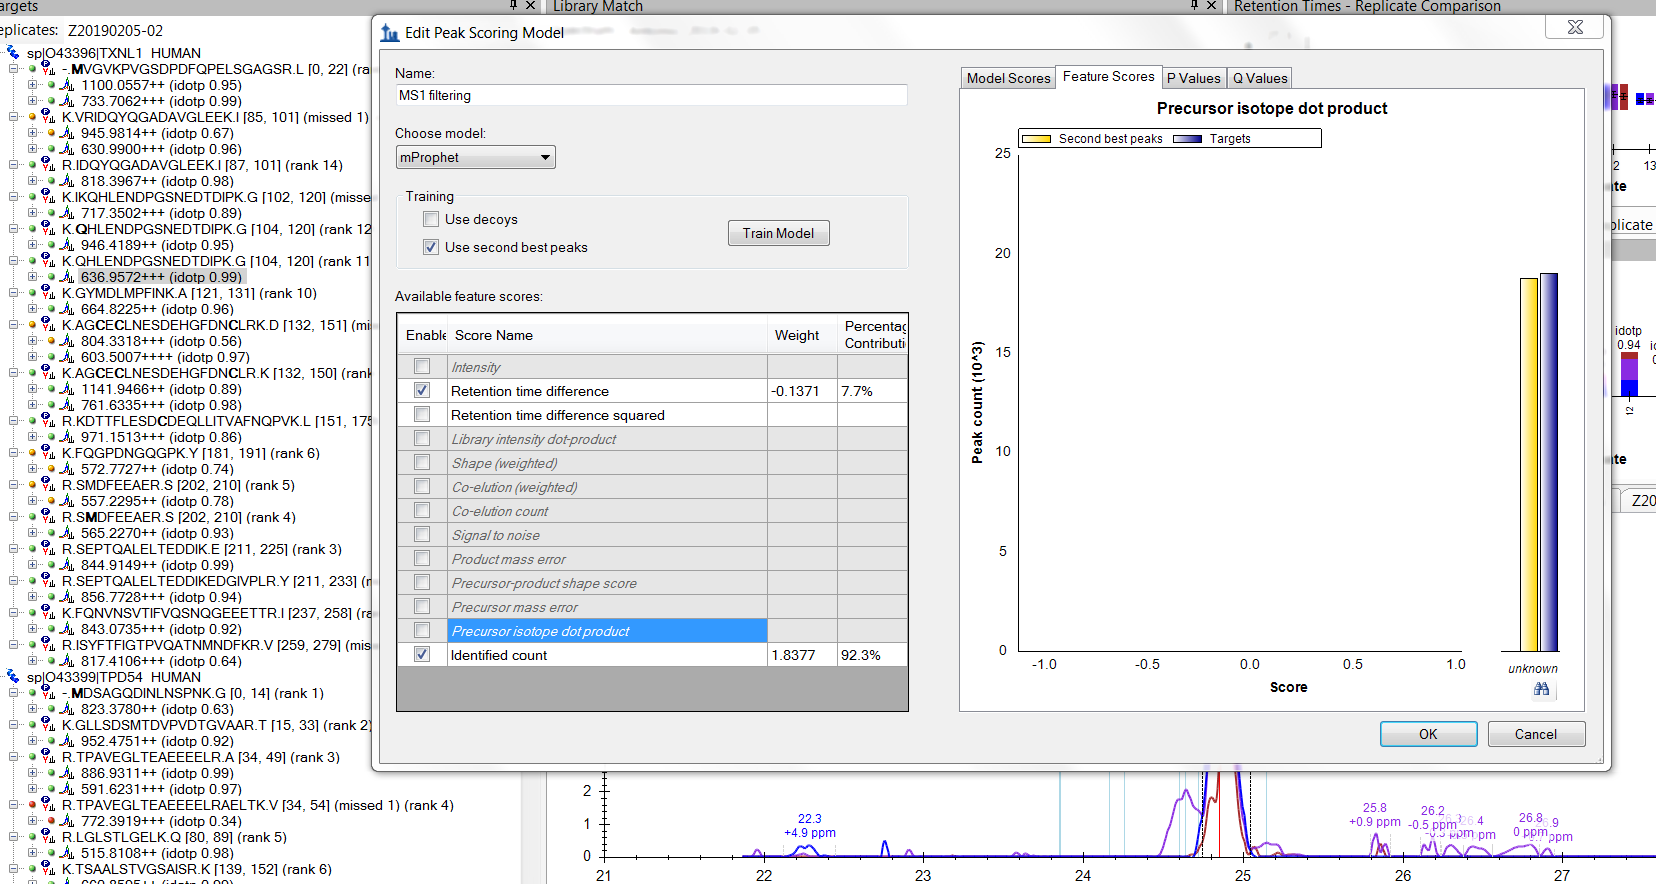
I am also very interested in trying this out. In my document (Lumos data, ~13.8K precursors), only "retention time difference [squared]" and "identified count" are available for the model. The remaining scores are greyed out, including "precursor isotope dot product" and "precursor mass error" which should be useful for the model. These scores are not showing up in the Feature Scores histogram and are displayed only in the "unknown" bar, but they appear to be calculated and displayed as usual in the rest of the document. Am I doing something incorrectly, or is this the expected behavior?
Thanks!
Anatoly |
| |
| aaron robinson responded: |
2019-02-18 15:54 |
|
| |
| anatoly.urisman responded: |
2019-02-18 21:22 |
Hi Aaron,
Thanks for the response. I actually did read the tutorial before posting :)
I don't think my problem is about missing values. I am including a screenshot for idotp.
In your document, are you able to see any values for idotp and precursor ppm error in the histogram and actually use these as part of the model?
Thanks,
Anatoly |
|
| |
| Brendan MacLean responded: |
2019-02-19 10:39 |
Hi Anatoly,
Can you post a screenshot of your Peptide Settings - Modifications tab? I have seen this kind of thing before in label-free experiments where the isotope labeling settings have not accurately reflected the experiment. I think in the past it has turned out to be that the standard type was set to "light". I believe this causes Skyline to think there is not any experimental measurements, just standards, which explains why even "Intensity" is grayed out.
Sorry for the confusing presentation.
--Brendan |
| |
| aaron robinson responded: |
2019-02-19 10:43 |
For sure, had to ask.
Attached is what mine looks like. |
|
| |
| anatoly.urisman responded: |
2019-02-19 21:42 |
Thank you, Brendan.
That was exactly the problem - I had internal standard type set to "light." I changed it to "None" and the rest of the scores are now available for the model. This is a fantastic addition to Skyline - thanks for your help!
Anatoly |
|
| |
| aaron robinson responded: |
2019-02-24 12:32 |
Hi Brendan,
I do have an issue with using this feature. It seems to me like the main reason to use it would be to get q-values which can be used for statistics.
However, in the "group comparisons" feature, despite setting a q-value cutoff (which I was really excited about having the ability to do), I don't see any changes in my statistics. It's unfortunate as this feature seemed great but I was underwhelmed when I wasn't able to use it for statistics and had to use MSSTATS in R with a q-value filter.
I noticed the same thing with DIA data and mProphet modeling.
-Aaron |
| |
| Nick Shulman responded: |
2019-02-24 13:29 |
Aaron,
From looking at the code, I think the "Q-Value Cutoff" that you can specify in the Advanced section of the Edit Group Comparison dialog does not actually do what it's supposed to do. It does affect things like which results are included in "equalize median" normalization, but it does not affect the more important thing of excluding results from a group comparison.
If you go to:
Edit > Refine > Reintegrate
and set a q-value cutoff there, you'll get the same numbers as you would have gotten if the Q-value cutoff worked in the Group Comparison setting, but being able to control for each Group Comparison you define was supposed to be a much faster way to compare different possible values for that.
I'll try to fix this in an upcoming release of Skyline-Daily.
-- Nick |
| |
 Capture.PNG
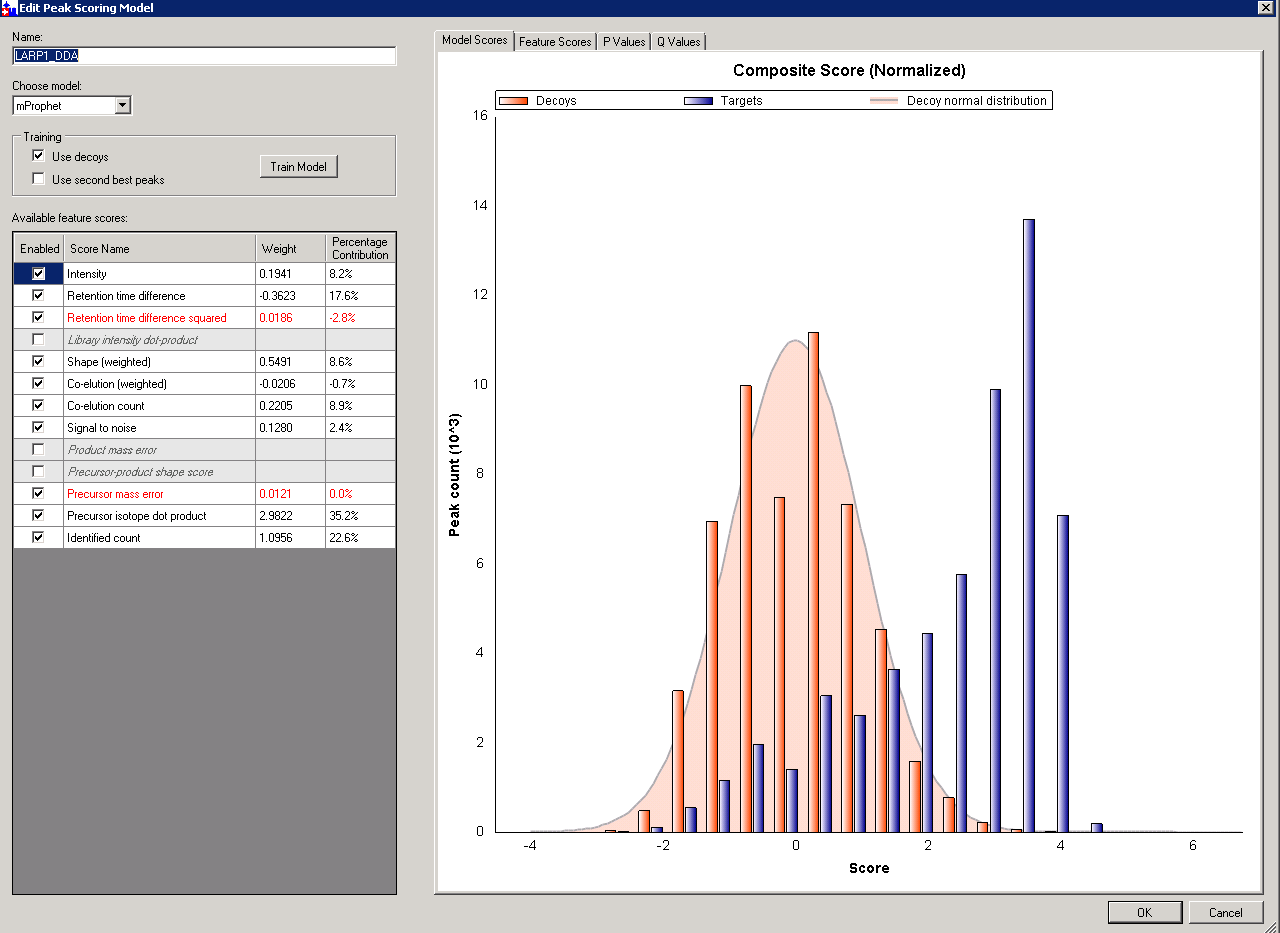 Peak_Scoring_Model.png
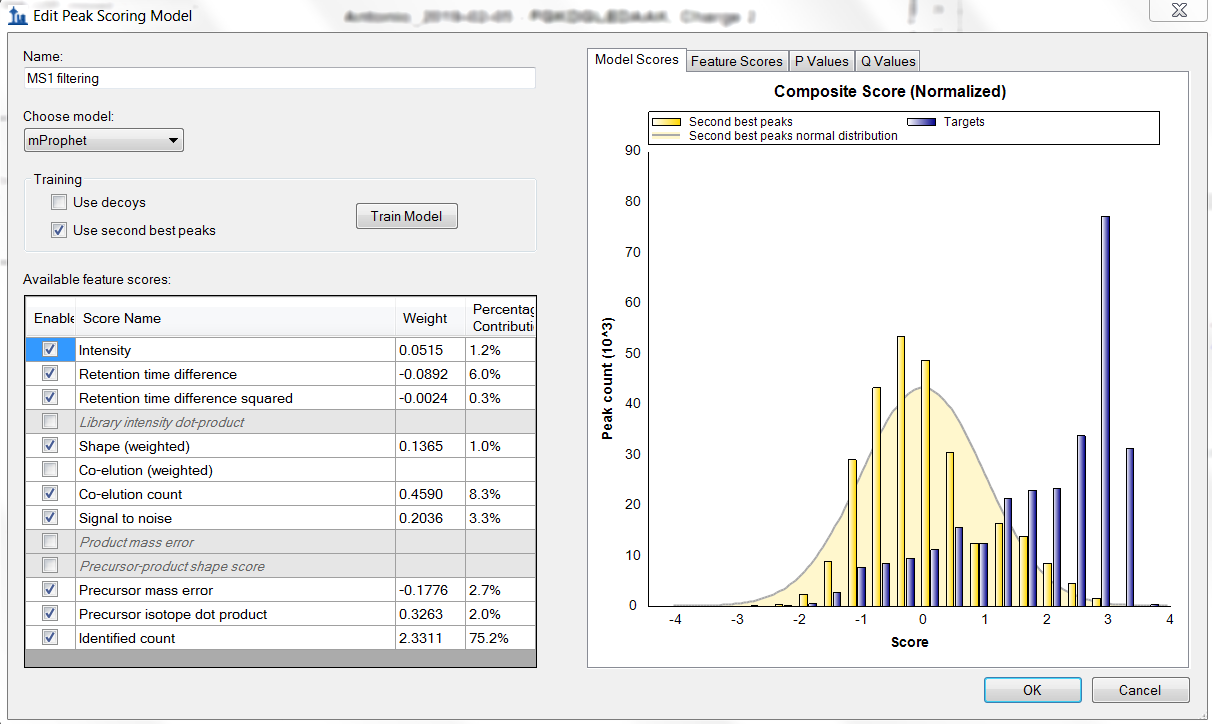 Capture2.PNG